Good morning, traders…
If you saw me looking disheveled on camera yesterday, thank you for not calling the CDC.
The Sturgill household just had one of “those” weekends. The norovirus ripped through my house like a hurricane. It got my youngest, then my wife, then my oldest.
By Sunday, I was down for the count, sick as a dog. My middle son gave the virus a clean sweep on Sunday night with his own personal rendition of The Exorcist.
No one slept much. Shaving wasn’t even a consideration. Survival was the only trade I was managing.
Yet even during my sickness, I couldn’t help but feel grateful. Memorial Day reminds me that freedom really isn’t free, and we owe everything to those who paid the ultimate price.
If you served for our country, or someone in your family has, I thank you from the bottom of my heart.
But now that the market’s back open, it’s time for us traders to get back to work.
Today, I’ll show you the most important charts on my radar, the technical indicators making them special, and my specific plans for trading these setups…
The First Chart I Pulled Up This Week
After the long weekend, the first chart I opened on Tuesday was the CBOE Volatility Index (VIX).
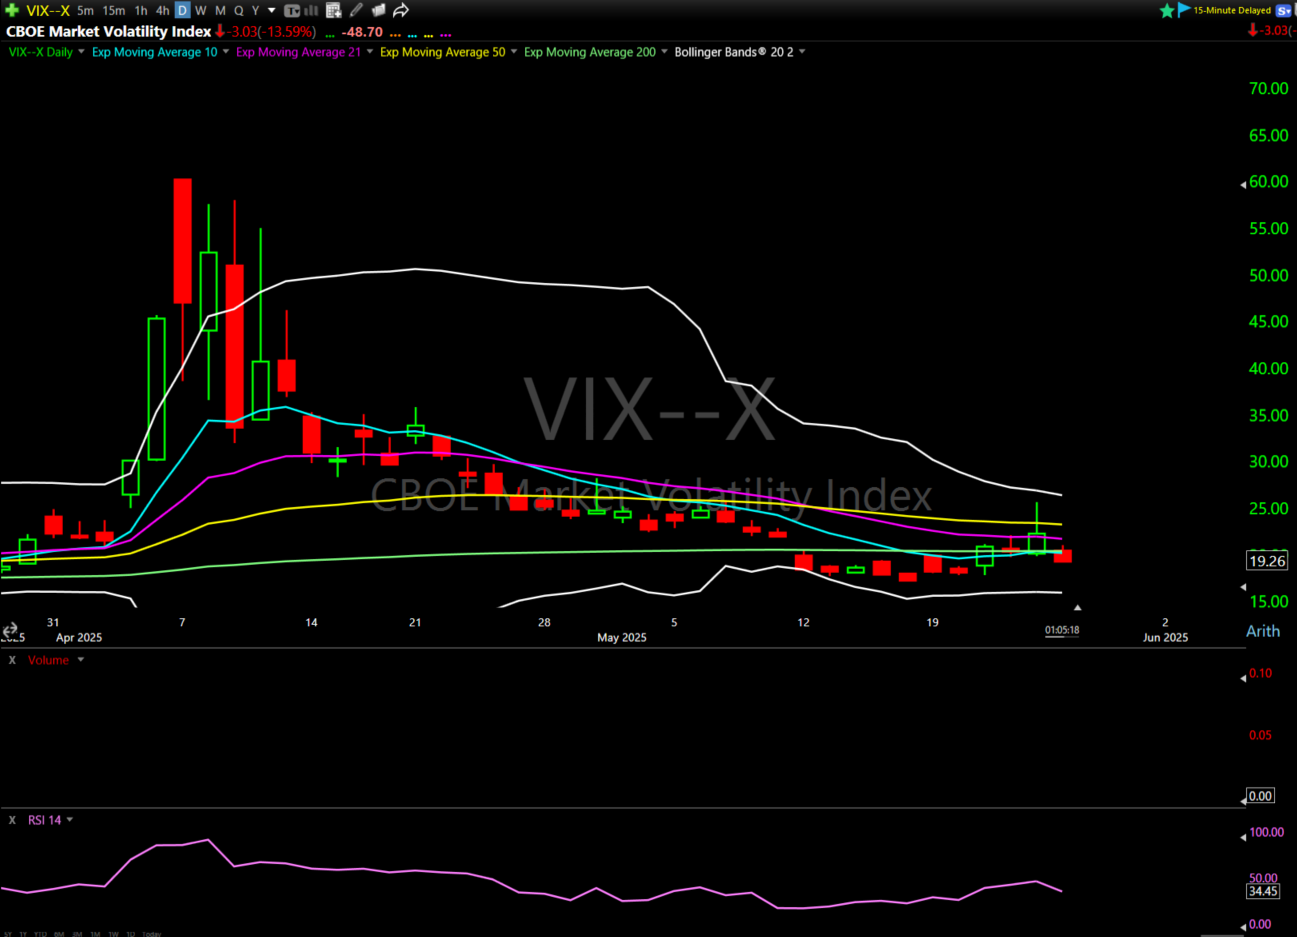
We got a small spike to the 25 level last week. But on Tuesday, the VIX cratered more than 13%, and the Bollinger Bands (the white lines above) continued to tighten up.
When the bands get this tight, we often see an “expansion move” — either a breakout or a breakdown beyond key levels. It’s a fork in the road…
I’d like to see a breakdown in the VIX and a bullish continuation in the major indexes. Less fear, more clarity.
The bullish signs are starting to flash in the internals: SPY’s 21-day moving average is now back above the zero line. If the 100-day can join it, the technicals will be primed for further upside.
Last week, I talked about the importance of playing market extremes and a specific indicator I use to do it…
Average True Range (ATR) is a volatility indicator that measures how much a stock typically moves during a given period (usually 14 days).
It doesn’t predict direction, but it tells you how wide the swings have been. Similar to implied volatility (IV) in options, a higher ATR means bigger moves (more volatility), while a lower ATR reflects calm, stable price action.
When a stock is trading 2 or 3 ATRs above its average, it often leads to a pullback or pause.
That’s why I suggested hedging with major index puts once the SPDR S&P 500 ETF Trust (NYSEARCA: SPY) stretched to a +3 ATR move last week.
And sure enough, Friday came, the indexes went red, and price reverted back to the mean.
That’s when I went long.
I grabbed the SPX July 31 $6500 calls. They popped nearly 50% just off the daily bounce. I’m still holding them, giving them plenty of time to do their thing.
Therein lies the benefit of time-based conviction…
6 Stocks to Watch This Week
Now, let’s look at some charts…
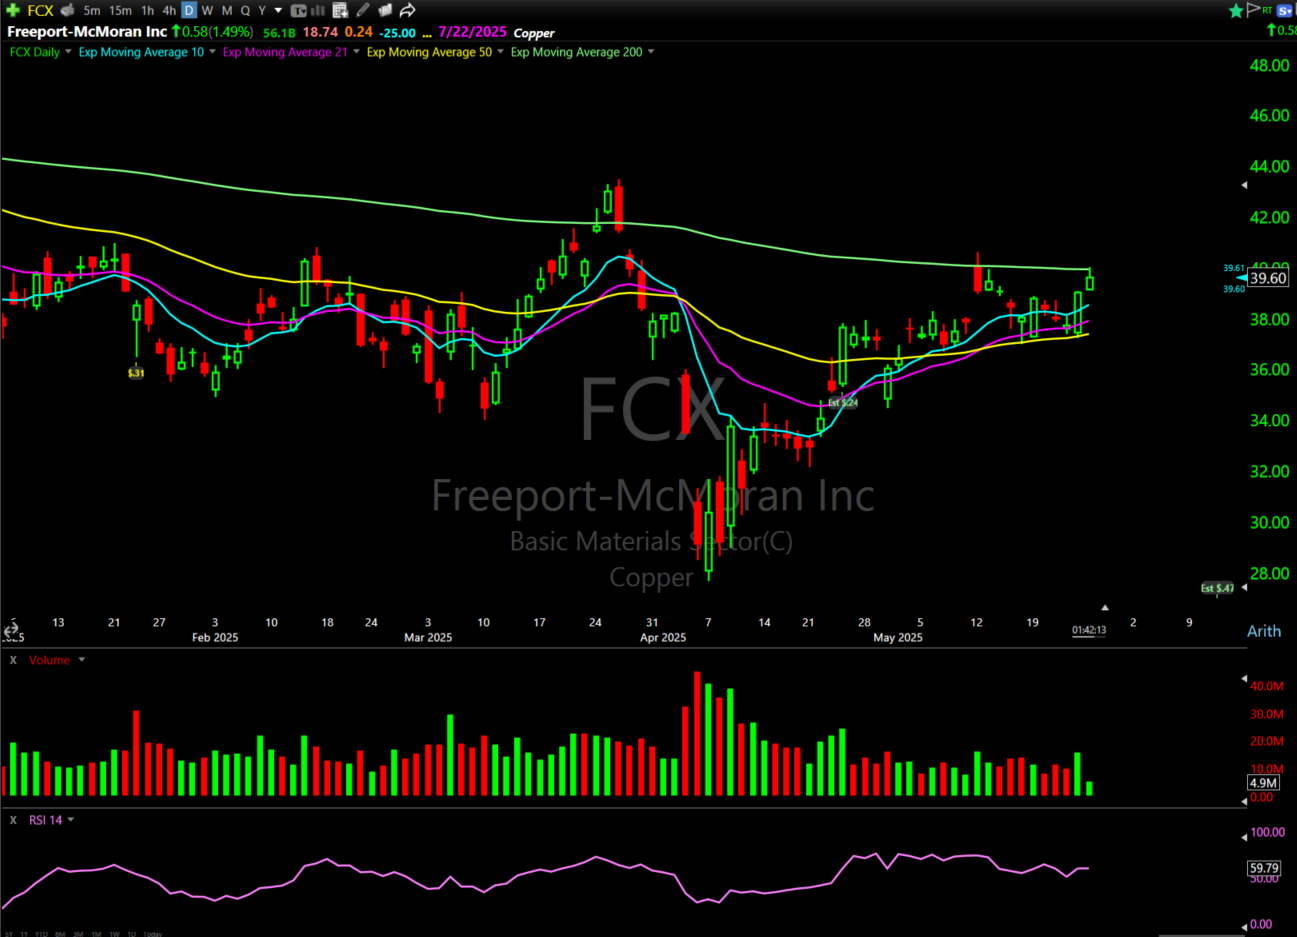
This one’s setting up beautifully. There was massive Smart Money flow into the June $41 calls, and the technicals back it up.
Compression is near support. Plus, the 21-day exponential moving average is in confluence with the 200-day moving average (a classic sign of a potential Stage 2 breakout).
Copper could be waking up if the economic cycle is really shifting. I’m watching $39.35 as a key trigger.
Vistra Corp. (NYSE: VST)
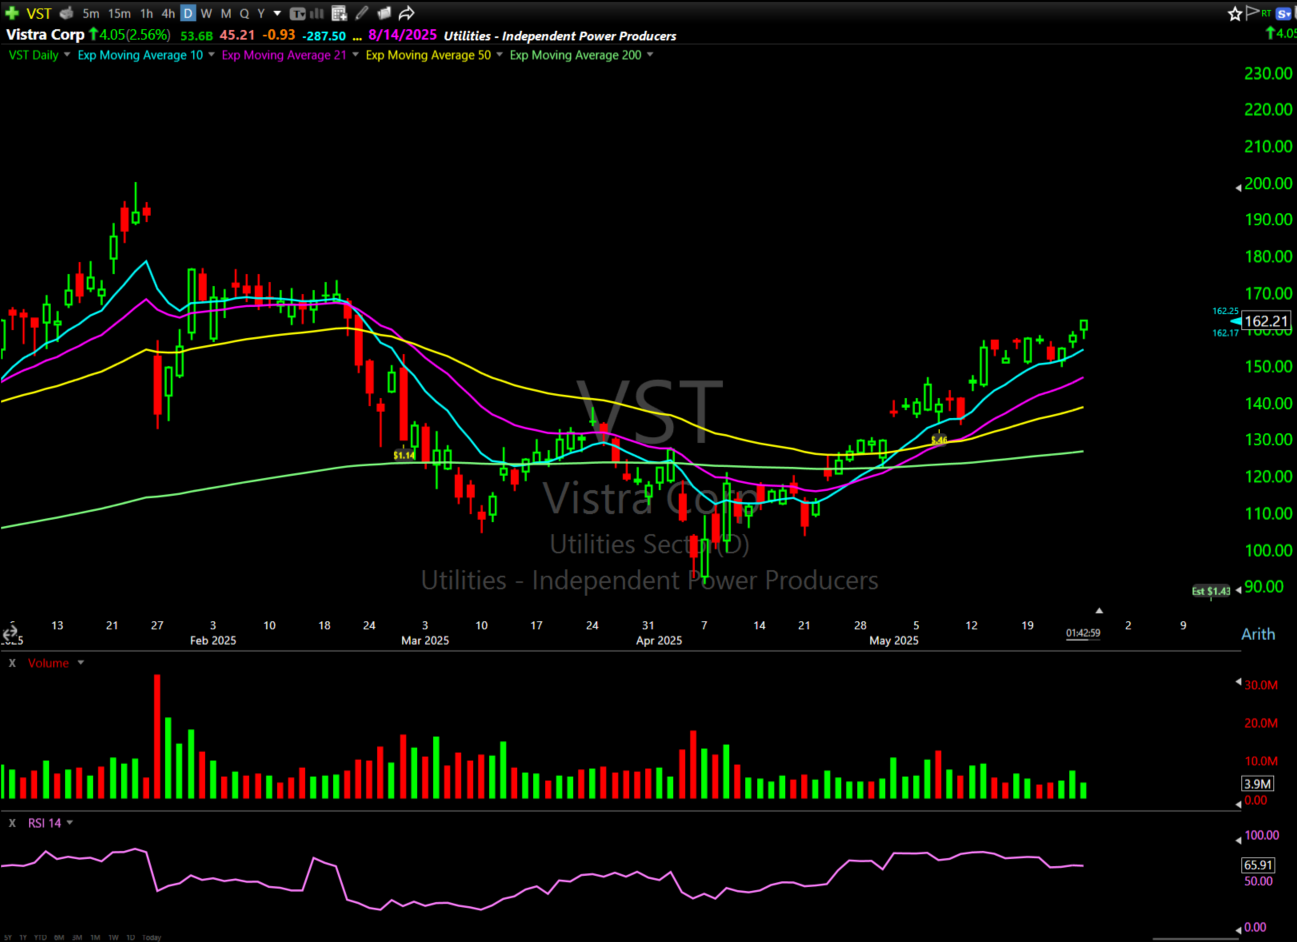
Classic pullback setup. The smart money showed up last week, loading June 175s and 180s.
You could either take a breakout above $163.50, or wait for a pullback to $158.50.
Either way, the technical structure is strong, and the options volume is confirming that strength.
JetBlue Airways Corporation (NASDAQ: JBLU)
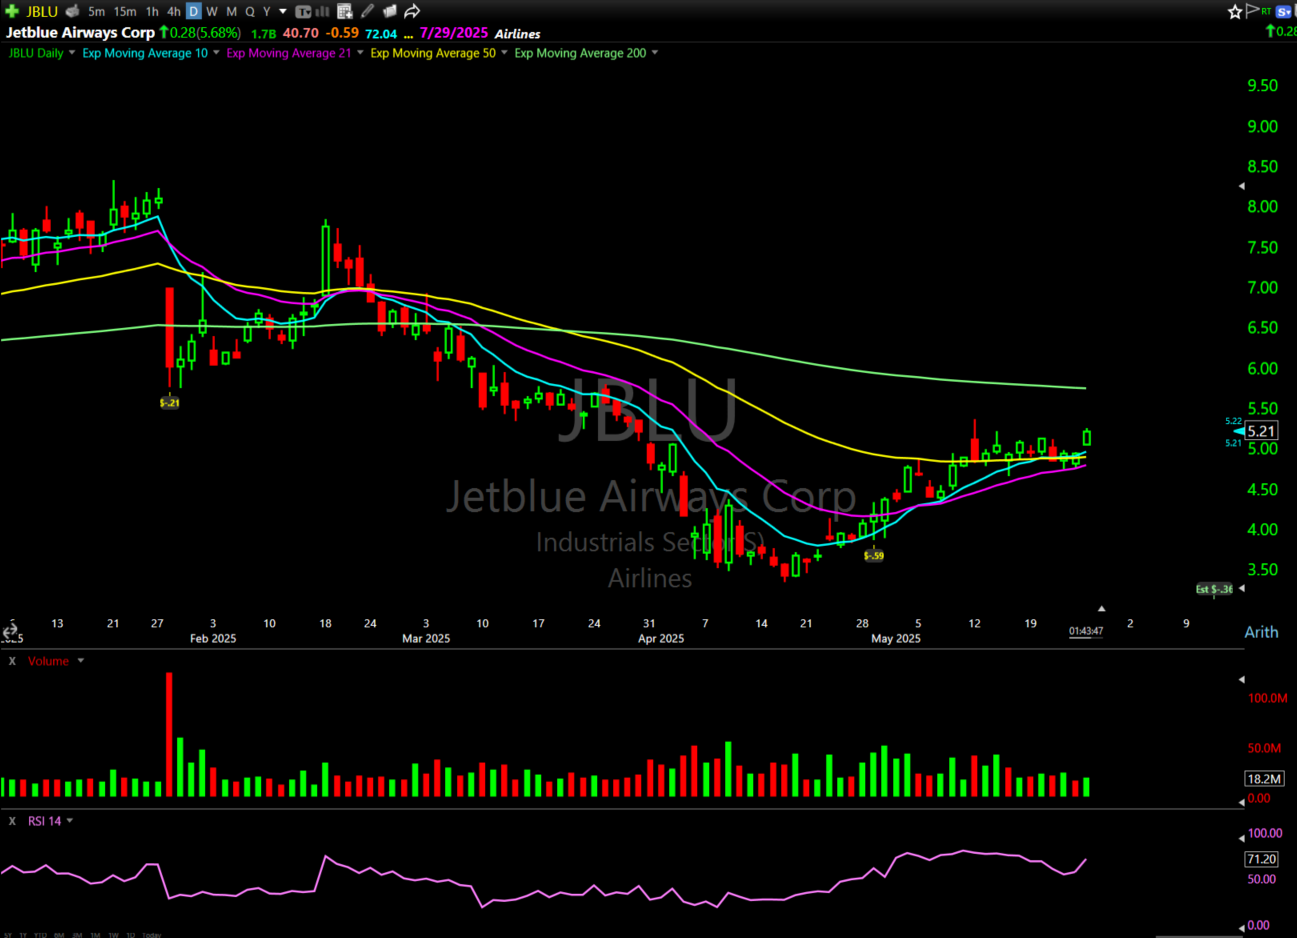
JetBlue is setting up a potential move off the $5 area. There was big flow into the July $5 calls.
It’s supply and demand at work: clean rejections with clean support. If this thing clears $5.10, the upside opens up in a big way.
Plus, the summer travel season could give this chart a little “tailwind” (excuse the pun).
Bilibili Inc. (NASDAQ: BILI)
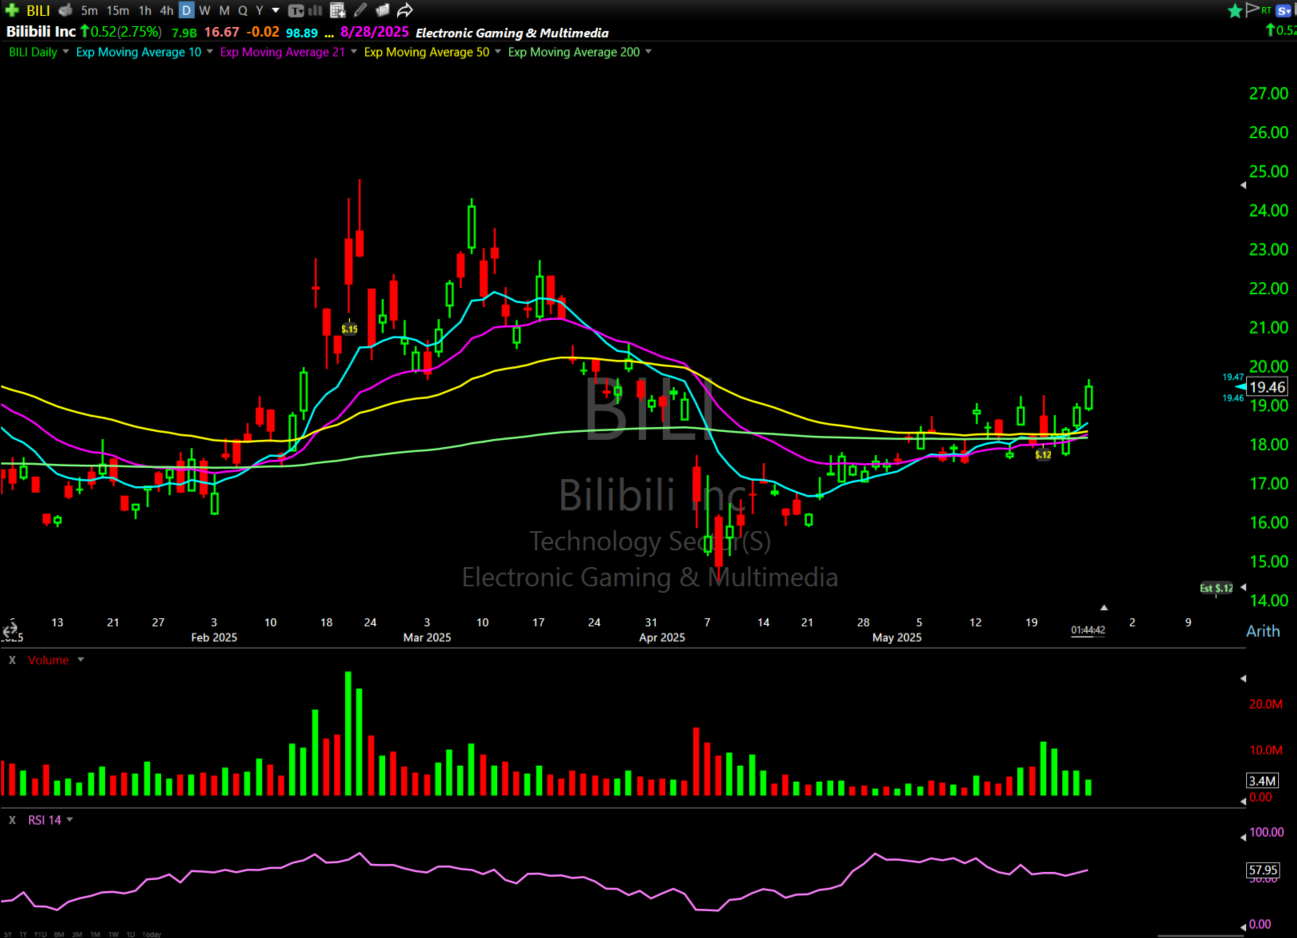
Smart Money was slamming the July $52.50 calls into the close Friday. Over $1 million in call volume came through, and the price is compressing nicely.
If this name gets above $48.50, it could be off to the races toward that point of control at $52.50.
Robinhood Markets Inc. (NASDAQ: HOOD)
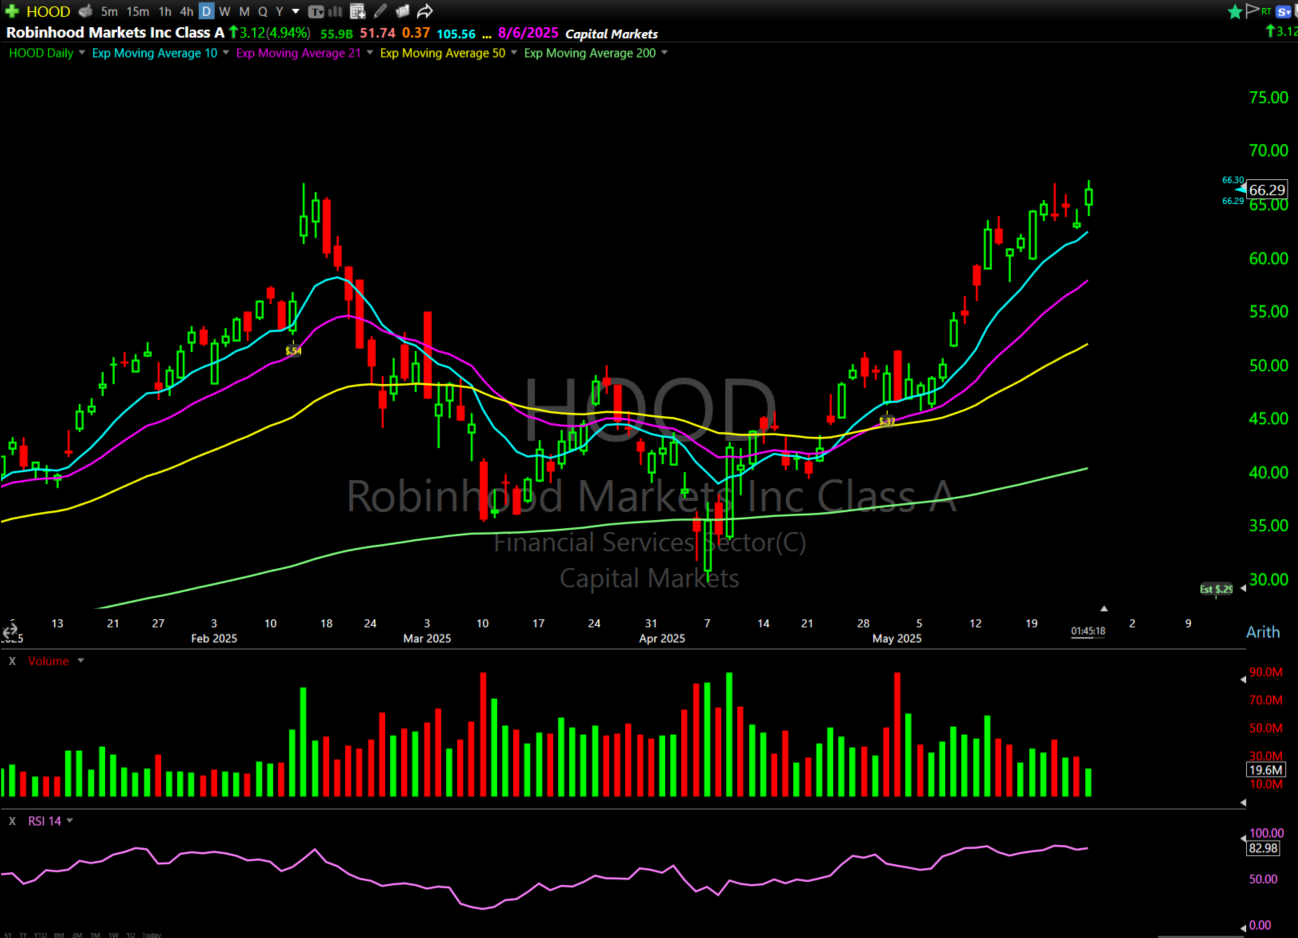
I’m watching June $66 calls. Look for a move towards $67 to confirm a break of trendline resistance.
Direxion Daily TSLA Bull 1.5X Shares (NYSEARCA: TSLL)
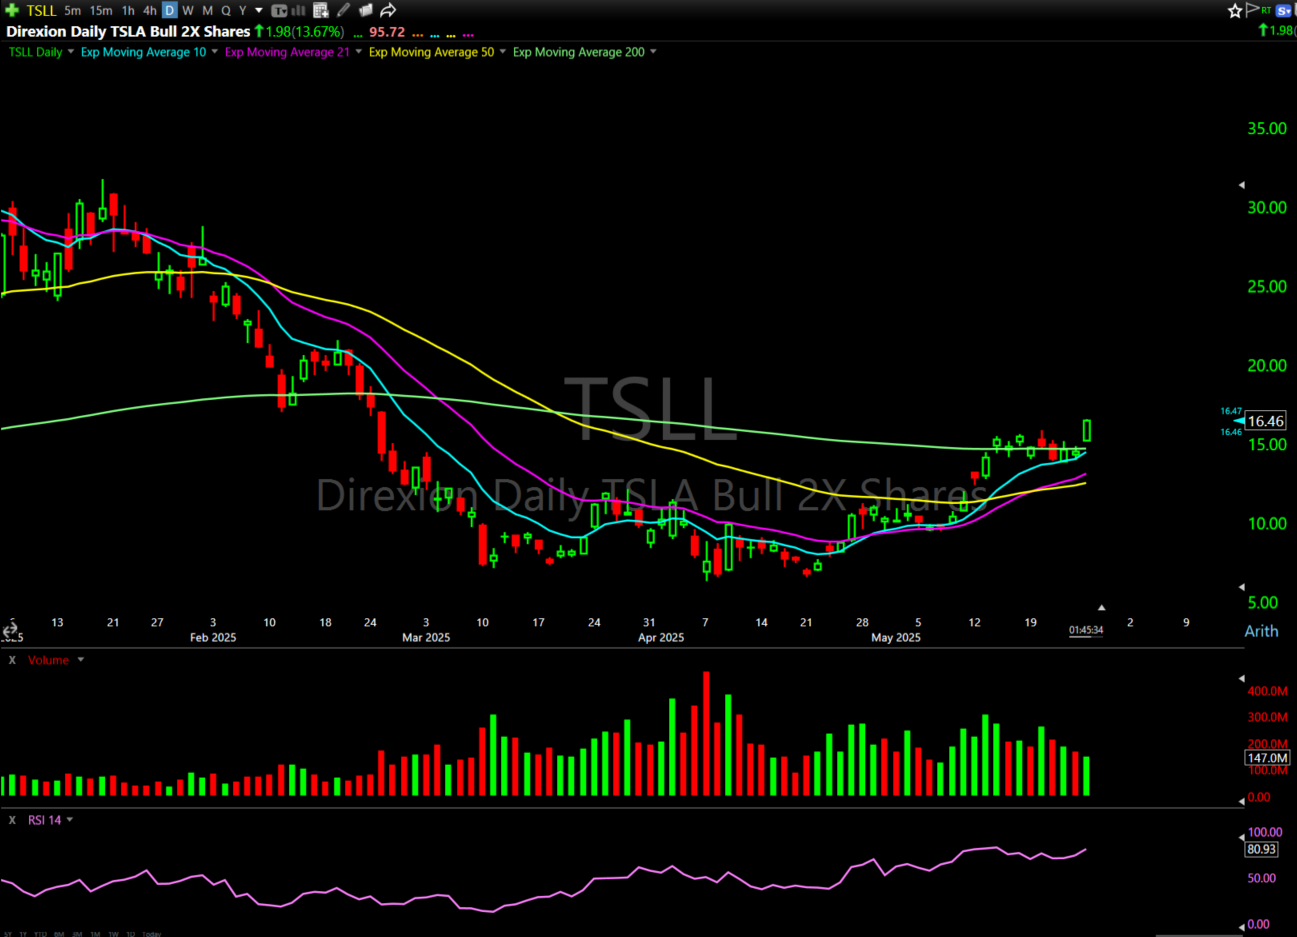
I recently called out the May 30th $14 calls, which look solid if this trend continues to build higher.
This week is all about keeping things simple, focused, and selective.
The setups I’ve outlined all have one thing in common: structure.
Whether it’s compression near support, volume flow confirming direction, or price reverting to a key level, I’m sticking with the charts forming the strongest overall patterns.
Happy trading,
Ben Sturgill
P.S. If you want access to the breakthrough system that’s tipped off some of the most profitable news events in recent memory with 89% accuracy…
Then NOW is the time to start using my OMEN System.
Join the great Aaron Hunziker, this Friday, May 30 at 12:00 p.m. EST for a LIVE OMEN TRAINING SESSION.
Stop missing Smart Money trades — Click here to reserve your seat.
*Past performance does not indicate future results