Happy Friday, traders…
Ben here.
Trading is largely a game of numbers…
Market caps, share prices, strike prices, volume, floats — all numbers.
But you don’t need to be Albert Einstein to be a successful options trader. I’m no math genius, and the best traders I know aren’t either.
That said, you do need to use numbers to track your trades.
Anyone can get an idea about a strategy that might work … while few can prove their method is profitable.
Tracking your trades will help you assess your performance honestly (with some valuable hindsight perspective).
For example: What chart patterns are working for you? Do you have more success trading calls or puts? Weekly or monthly contracts? Does a certain time of day work better than others?
The only way to answer these questions is by tracking your trades diligently.
Here’s how to do it…
Keep a Trading Journal
The first step to tracking your trades is keeping a trading journal.
Make a simple spreadsheet that includes the following information:
- Ticker
- Entry time and exit time
- Entry share price and exit share price
- % Gained/Lost
- Volume
- Market cap
- Charts
- Catalyst
- General Notes
Add a separate section for options columns:
- Expiration date
- Contract price
- Call or Put
- Option Volume
- Open Interest
- ‘The Greeks’ – delta, gamma, theta, and vega
Input every trade you make religiously and you’ll have a priceless resource for tracking your trades.
Check out this video where Tim Sykes lays down some trade-tracking wisdom:
Learn from Your Past Trades
After you’ve entered your trades consistently for a few weeks or months, you’ll be able to see trends in your successes … and your failures.
This will illustrate how different factors affect the ultimate outcomes of your trading decisions.
For example, you may notice that you have more success trading calls than puts. (This is definitely the case with me.)
Your journaling may reveal you do better as a swing trader, while you tend to win less on day trades. Or vice versa.
Whatever you do, don’t make your spreadsheet too fancy. Make it fun. It’ll help you build a routine for tracking your data.
Don’t think of it as a chore. Think of it as a game that can improve your trading skills.
Once you’ve journaled your trades for a few weeks, you can begin to backtest the performance of your strategy…
Begin Backtesting
Backtesting is a method used to evaluate the performance of a trading strategy by applying it to historical market data.
The idea is to see how the strategy would have performed in the past to estimate its effectiveness in the future.
Most online trading platforms provide access to historical market data, including price history, trading volume, and other relevant information.
WARNING: Make sure that the data you’re gathering covers a sufficient time period and is representative of the market conditions you’re currently trading.
If you’re looking for a broker with great data, I suggest using StocksToTrade.
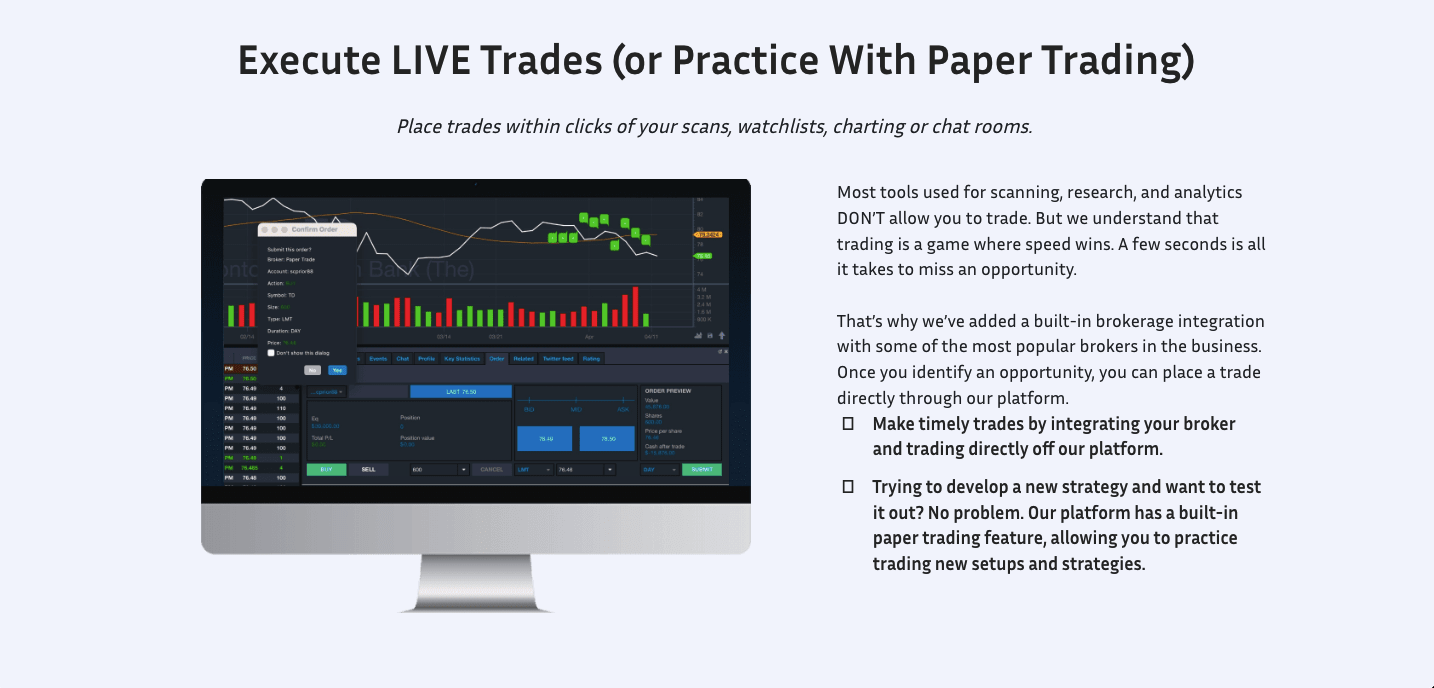
Most tools used for scanning, research, and analytics DON’T allow you to trade. But StocksToTrade does, plus so much more…
See for yourself — Get a 14-day trial of StocksToTrade for just $7 by clicking right here!
Manual Testing
Now that your software is set up, begin by manually testing your strategy on the historical data you’ve collected.
This means going through the data, trade by trade, applying your predefined rules, and then recording the outcomes.
Reference your journal to track each trade’s entry and exit points, profits or losses, and any relevant observations.
The manual testing phase helps you understand how your strategy would have performed in the past, giving you valuable insights into its potential strengths and weaknesses moving forward.
Paper Trading
Another excellent way to manually test your strategy is by paper trading.
Paper trading allows you to try out a wide variety of strategies, setups, and patterns with simulated dollars.
When you set up a paper trading account, don’t simulate millions of dollars…
This can skew your early views of the relationship between risk and reward. Additionally, it forces you to deal with large numbers you don’t need to worry about yet.
Instead, simulate the account value you’ll actually be trading.
Then, start trading simulated dollars exactly as you plan to within your strategy.
If you make solid returns during this testing phase, you might be on to something…
But if you blow up your paper trading account, you’ll know your strategy isn’t ready for primetime yet.
Performance Evaluation
Once you’ve done live trading, paper trading, and consistent journaling — you’ll need to step back and evaluate your strategy’s performance.
When evaluating your strategy, go back to your journal and look at:
- Total return
- Average return per trade
- Win rate
- Average time in a trade
How is your strategy holding up?
Consider your maximum drawdown (the largest decline in your portfolio value). Would you be able to stomach these losses with real money?
Performance evaluation helps you understand how your strategy might perform in different market conditions and its potential risk/reward characteristics.
Based on the results of your testing and performance evaluation, you can tweak and refine your growing trading strategy.
Identify areas for improvement, such as adjusting entry or exit criteria, modifying risk management rules, or exploring additional indicators.
Repeat the testing process after each adjustment you make. Tweak until you’re winning consistently. Rinse and repeat.
Happy trading,
Ben Sturgill
P.S. This Monday, August 26 at 12:00 p.m. EST, I’m hosting a LIVE WEBINAR where I’ll be breaking down the most promising options-trading setups I’m watching for the week.
Stop missing huge trading opportunities — Click here to reserve your seat!