Good morning, traders…
Over the weekend, the U.S. launched a strike on Iranian nuclear facilities.
This has been a clear possibility ever since the Israel-Iran conflict broke out last week, but now it’s a hard reality.
War is ugly. I pray it doesn’t get worse from here.
As traders, we’re not looking to profit from bad events. But we need to trade the market we have, not the one we want.
This isn’t a time for political opinions. It doesn’t matter what you think about these events … what matters is how the market reacts.
When big geopolitical events happen, you don’t panic or speculate. You focus. You pay attention to the price action, the data, and the technical signals that matter.
I’m not completely revamping my strategy due to what’s happening overseas. But I am making some necessary adjustments.
A few names have climbed to the top of my watchlist, while one specific technical indicator has become too crucial to ignore…
Here’s What I’m Watching This Week (And Why These Charts Matter NOW)…
The Coachella of Macroeconomics
Before I open any charts, I look at the economic calendar.
And this week’s lineup is absolutely stacked.
It’s like the Coachella of macroeconomics:
- PMI flash
- Existing‑home sales
- Consumer confidence
- Durable goods and wholesale inventories
- Q1 GDP second revision
- Personal income and PCE inflation
- Consumer sentiment on Friday
- Jerome Powell testifying to the House Financial Services Committee on Tuesday and likely Wednesday
In this week’s live sessions, we’ll talk through what these data points mean and plan out the setups that grow from them.
Speaking of setups, let’s look at 8 charts I’m watching today:
CBOE Volatility Index (VIX)
The VIX is the most important chart in the world right now…
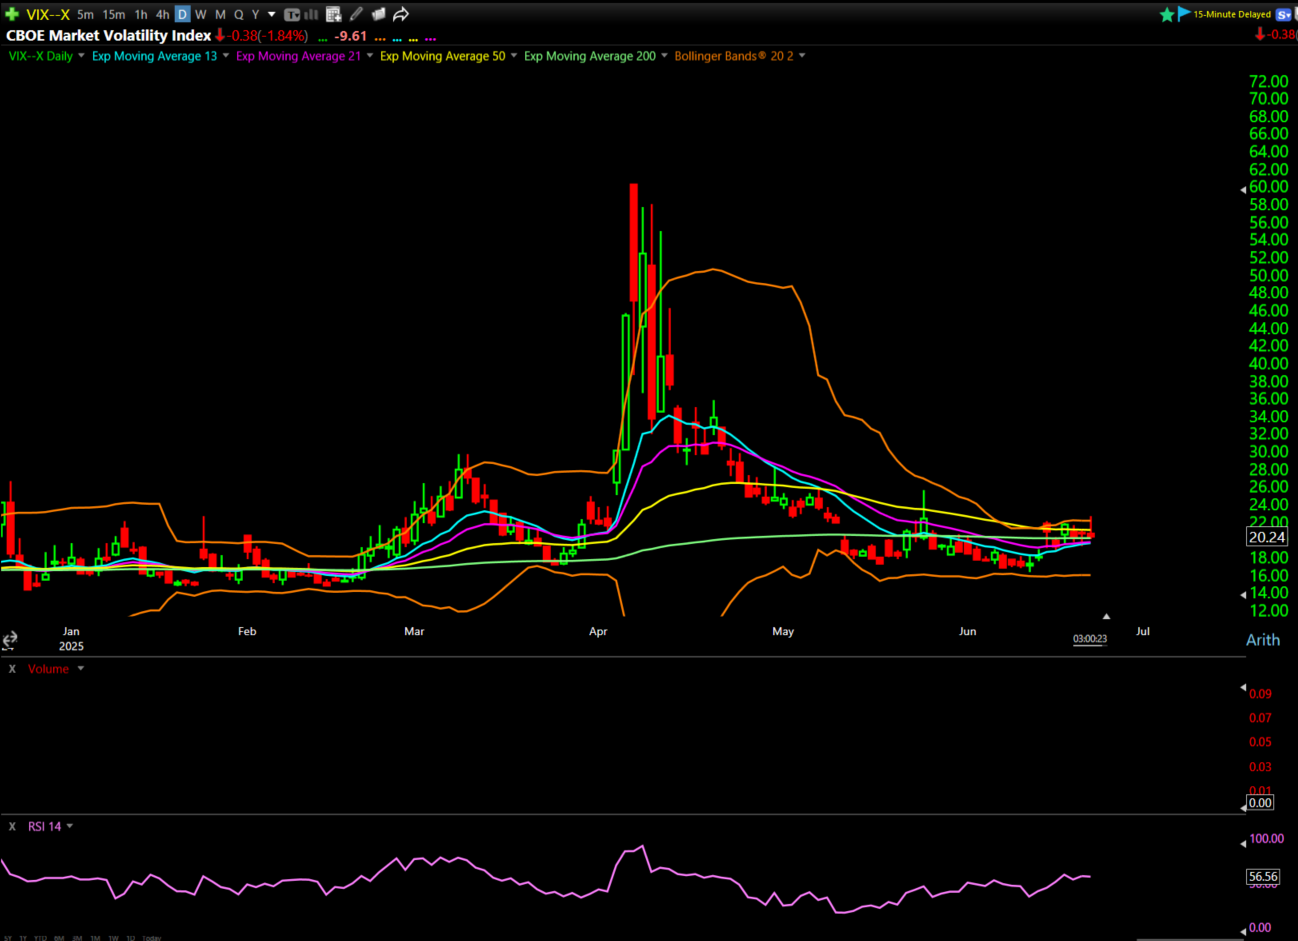
Markets have been drifting on low fear and low volume, but when the VIX breaks (up or down), it will dictate how risk-on (or off) the Smart Money acts.
It’s the fuse for momentum across equities, options pricing, and hedging behavior.
The VIX had been sitting below the middle of the Bollinger Band, then popped above it on the 12th and hasn’t looked back.
It’s held above $19, tested $22, and the Bollinger Bands are still tight. I think it wants to go higher.
SKEW is also ticking up. If it pushes above 156, that’s when I start watching for longer‑dated put flow and consider hedging call positions with SPY puts.
SPDR S&P 500 ETF Trust (NYSEARCA: SPY)
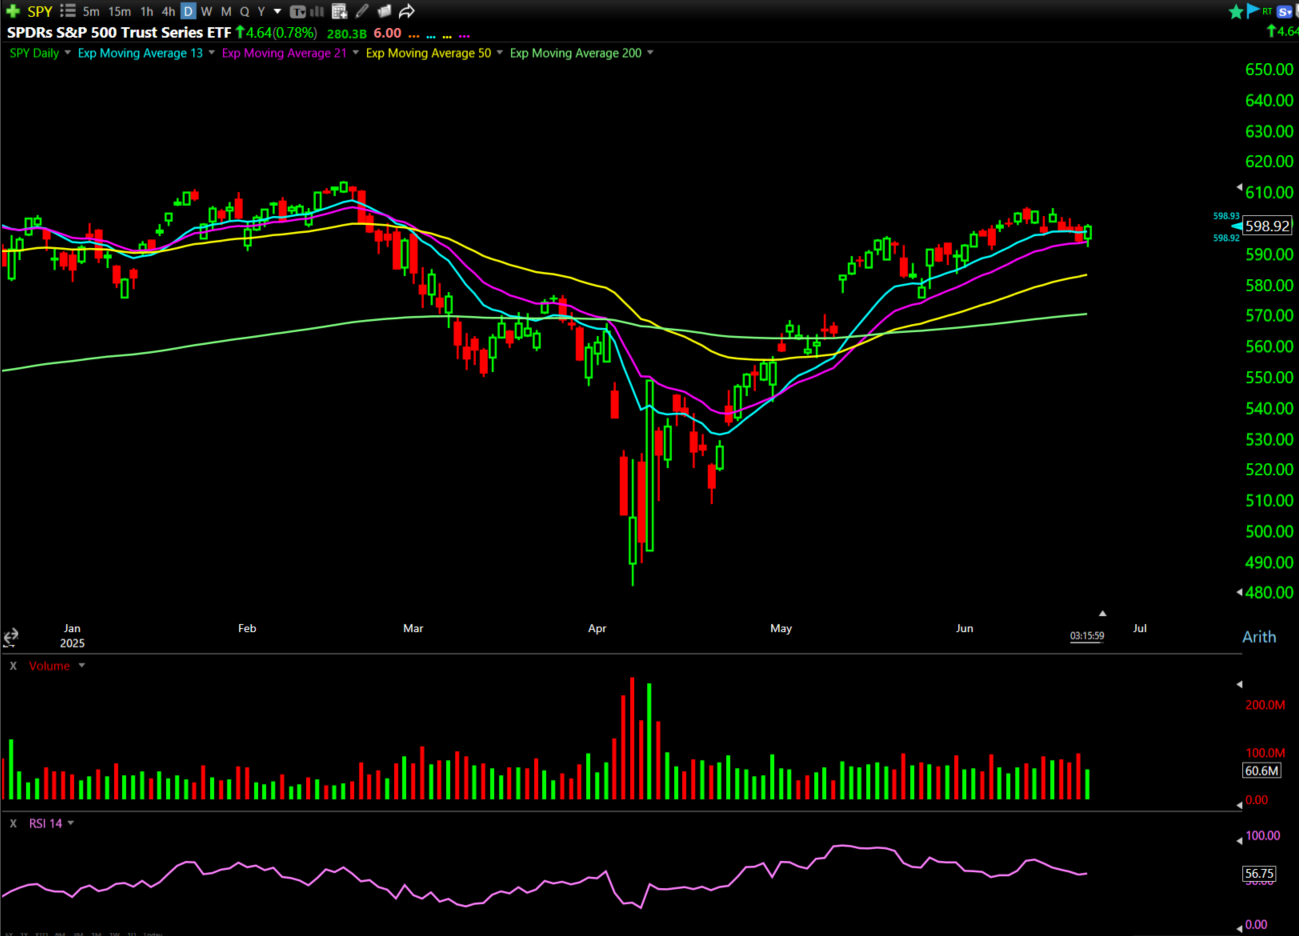
SPY remains rangebound. It keeps respecting that multi‑day VWAP and the downtrend line around $591.
As long as that level holds, I’ll keep watching for continuation. If we break below it, I’ve already set an alert.
This chart has been coiling since May. It’s ready for a major break up (or down).
Tesla Inc. (NASDAQ: TSLA)
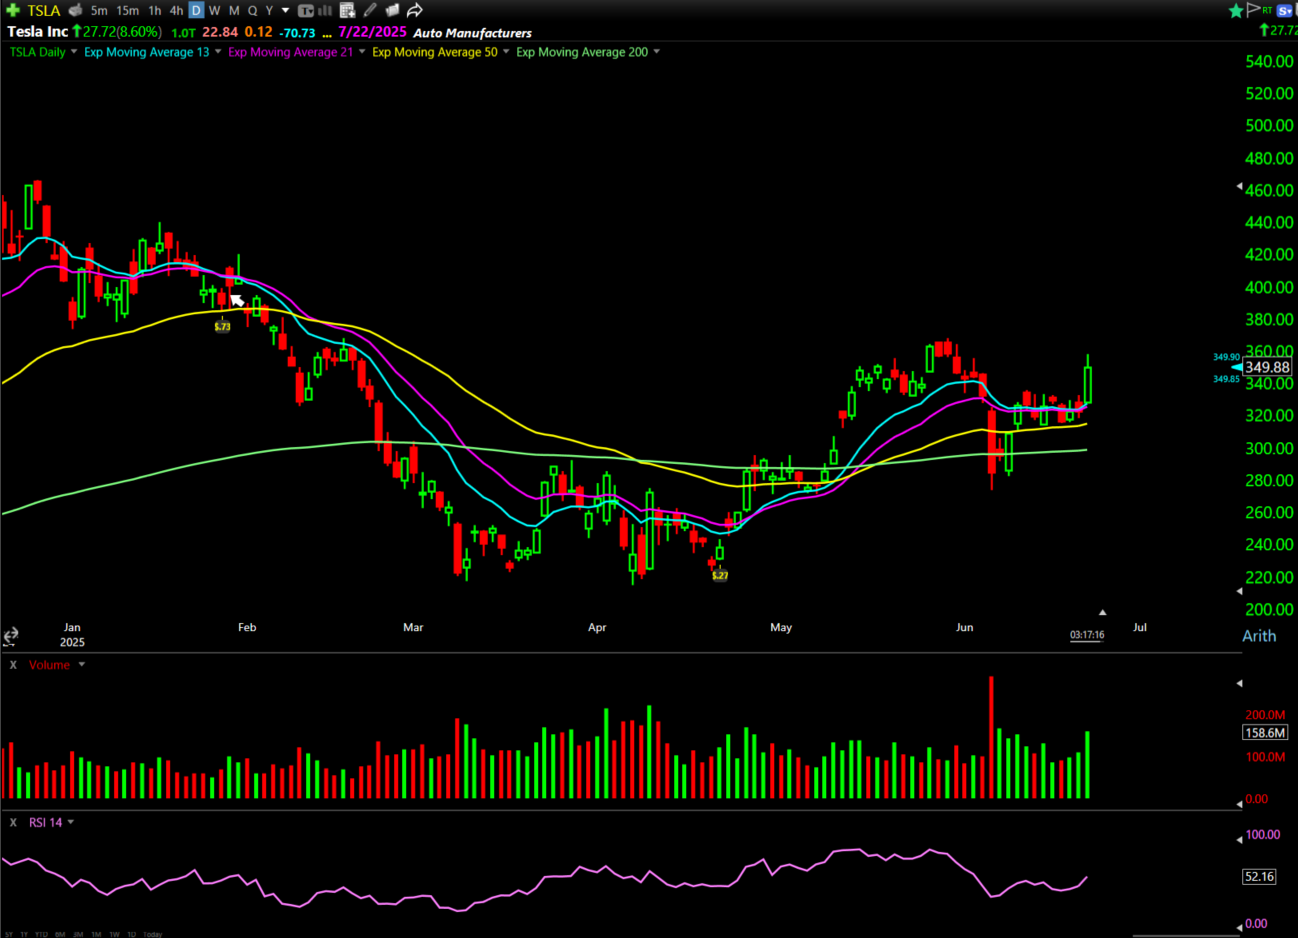
It’s coiling, and it wants to go higher. If it breaks above $333, I’ll be watching the June 27 $357 calls.
I’ve said it before: This could be a $1,000 stock someday.
Until then, I like the setup for near-term calls.
Occidental Petroleum Corporation (NYSE: OXY)
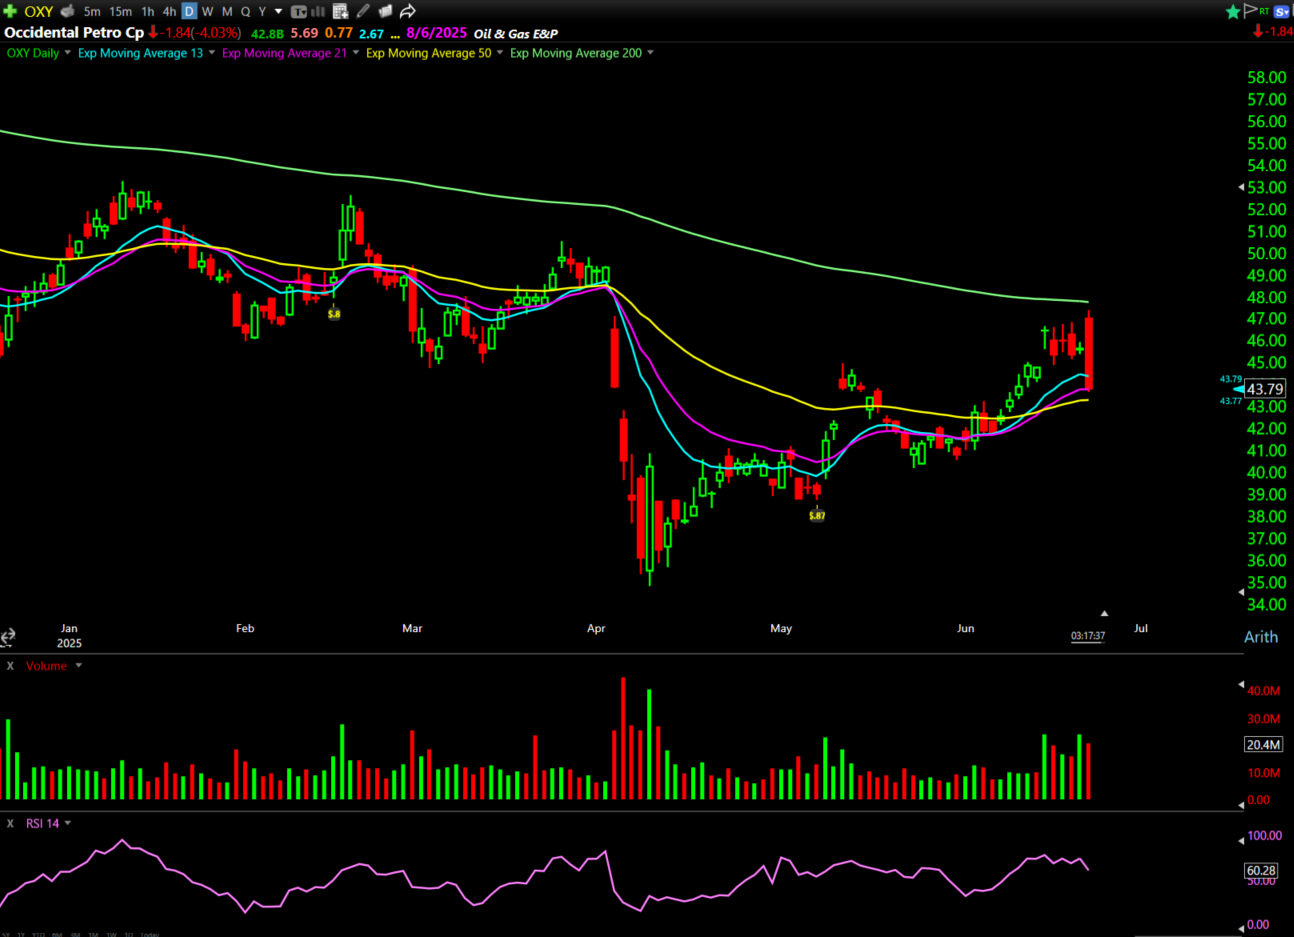
On Friday, the August 15 $50 calls came in, possibly as part of a spread.
The chart shows a bull flag. If OXY gets above $46.90, those calls make a lot more sense.
Yesterday, we saw this weird, counterintuitive down day in oil stocks. But that could be a short-lived fakeout.
Iran has threatened to close the Strait of Hormuz, which controls 20% of the global oil supply.
I want to be prepared if that happens. OXY is my favorite way to play that possibility.
T. Rowe Price Group Inc. (NASDAQ: TROW)
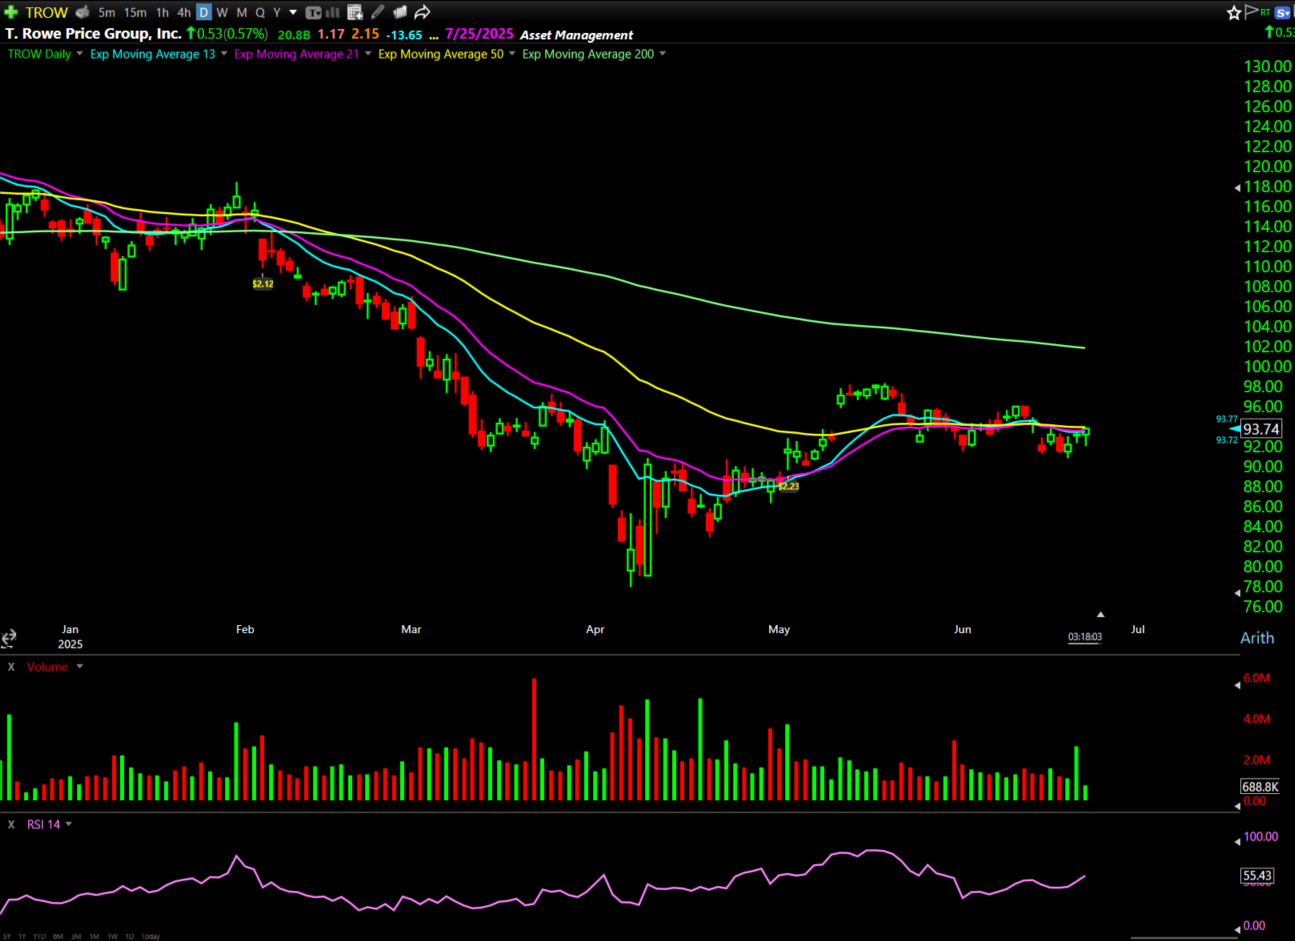
I haven’t talked about this name in a minute, but it tends to surge following big options volume.
And guess what? Friday saw six‑figure sweeps hitting ask side into the close.
The chart is compressing at the point of control. If it gets above $94, I’ll be eyeing the July $95 calls.
Robinhood Markets Inc. (NASDAQ: HOOD)
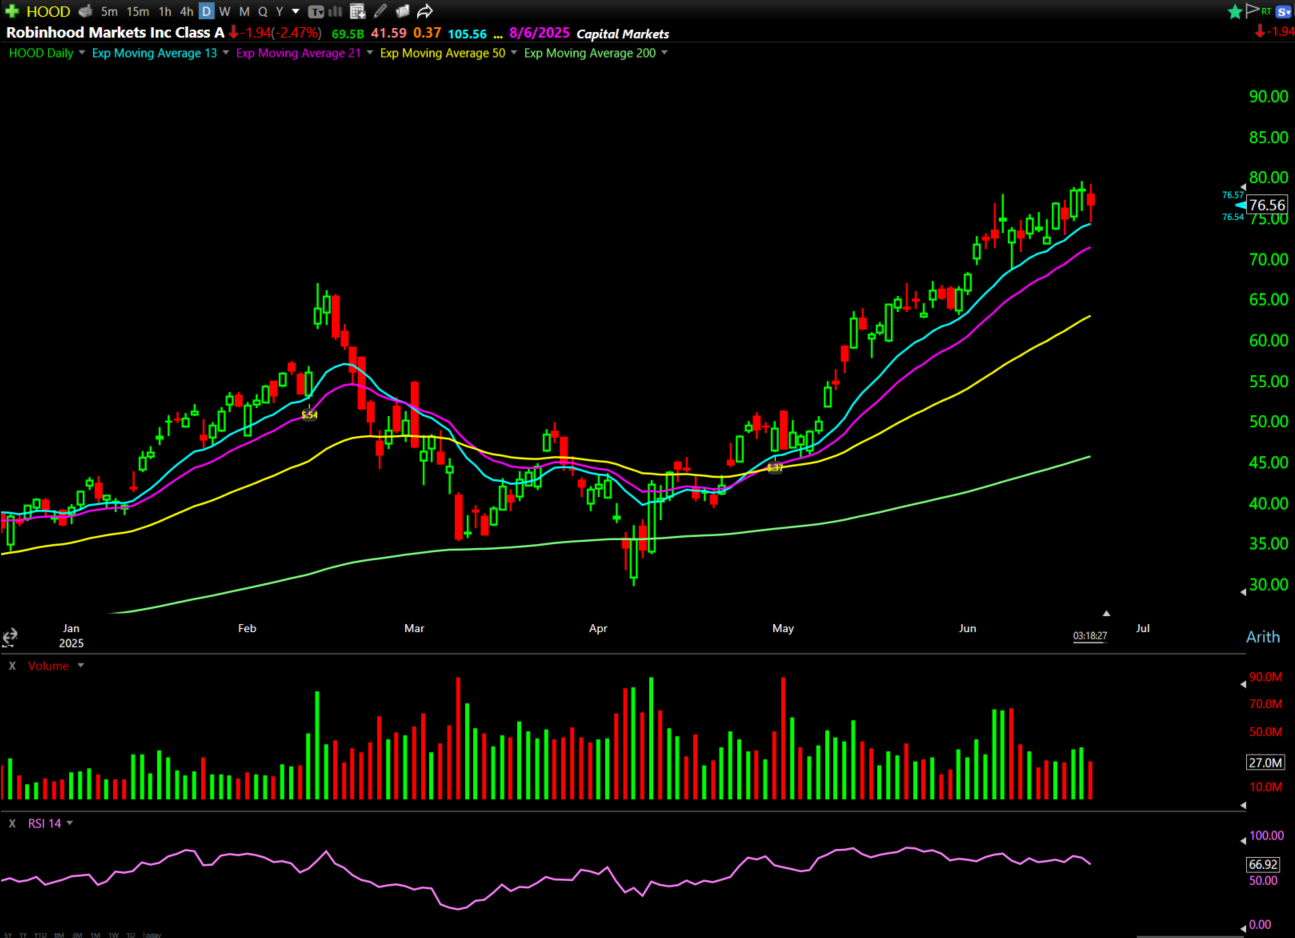
This is one of the most beautiful charts in the market.
It’s currently hovering in the $75–78 range. If it holds above $77, or pulls back to $75–76, I think we could see a move toward $85 over the next few weeks.
Look at the 10-day exponential moving average (blue line on the chart).
The daily chart has been surfing this line perfectly. Any pullback to the 10 EMA is a potential buying opportunity.
Palantir Technologies Inc. (NYSE: PLTR)
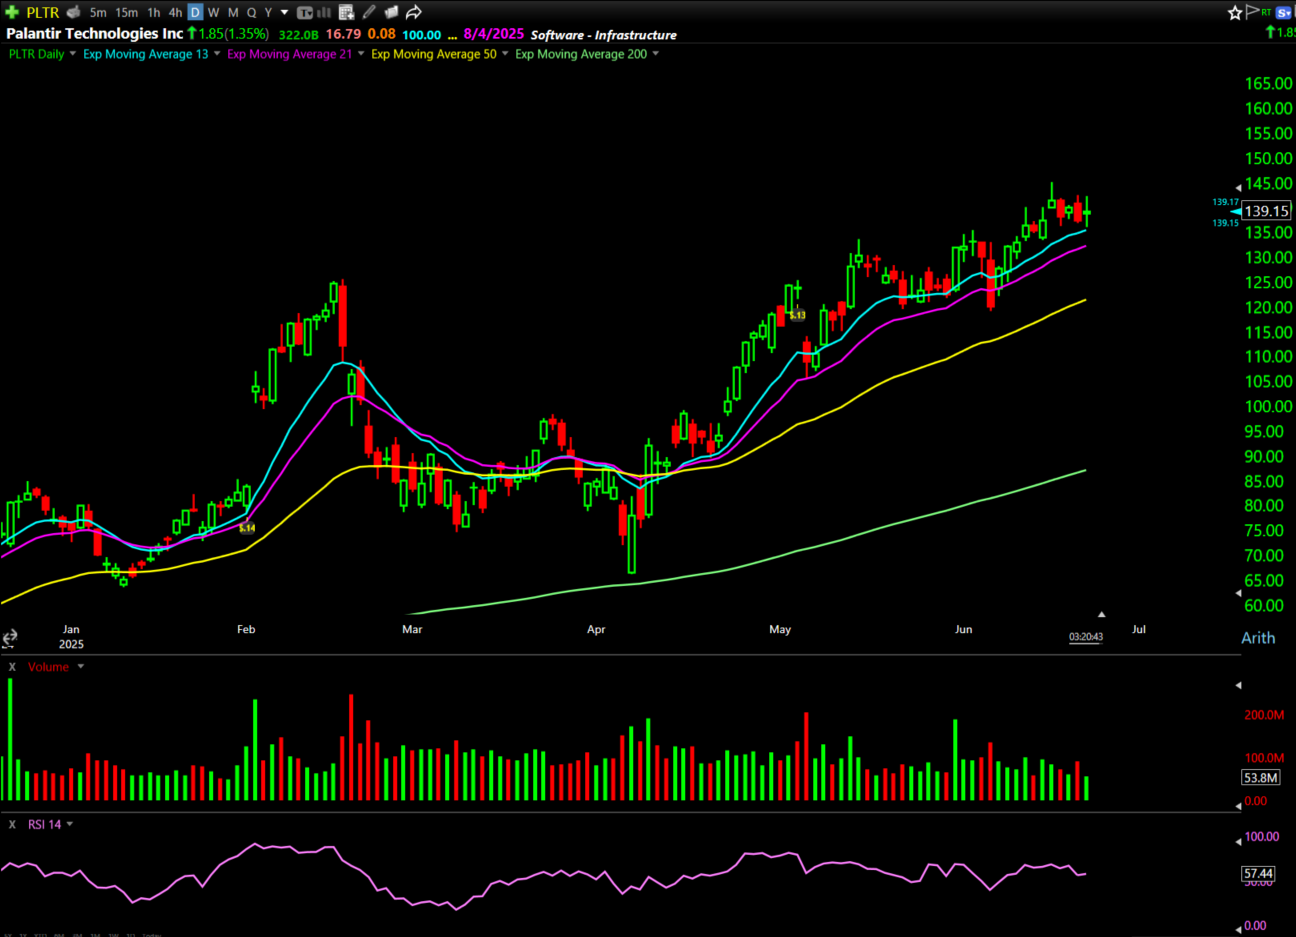
I added more around $133. If it breaks above $140, I’m looking for a move to $145 this week.
Either a pullback buy or a breakout setup works here.
Apple Inc. (NASDAQ: AAPL)
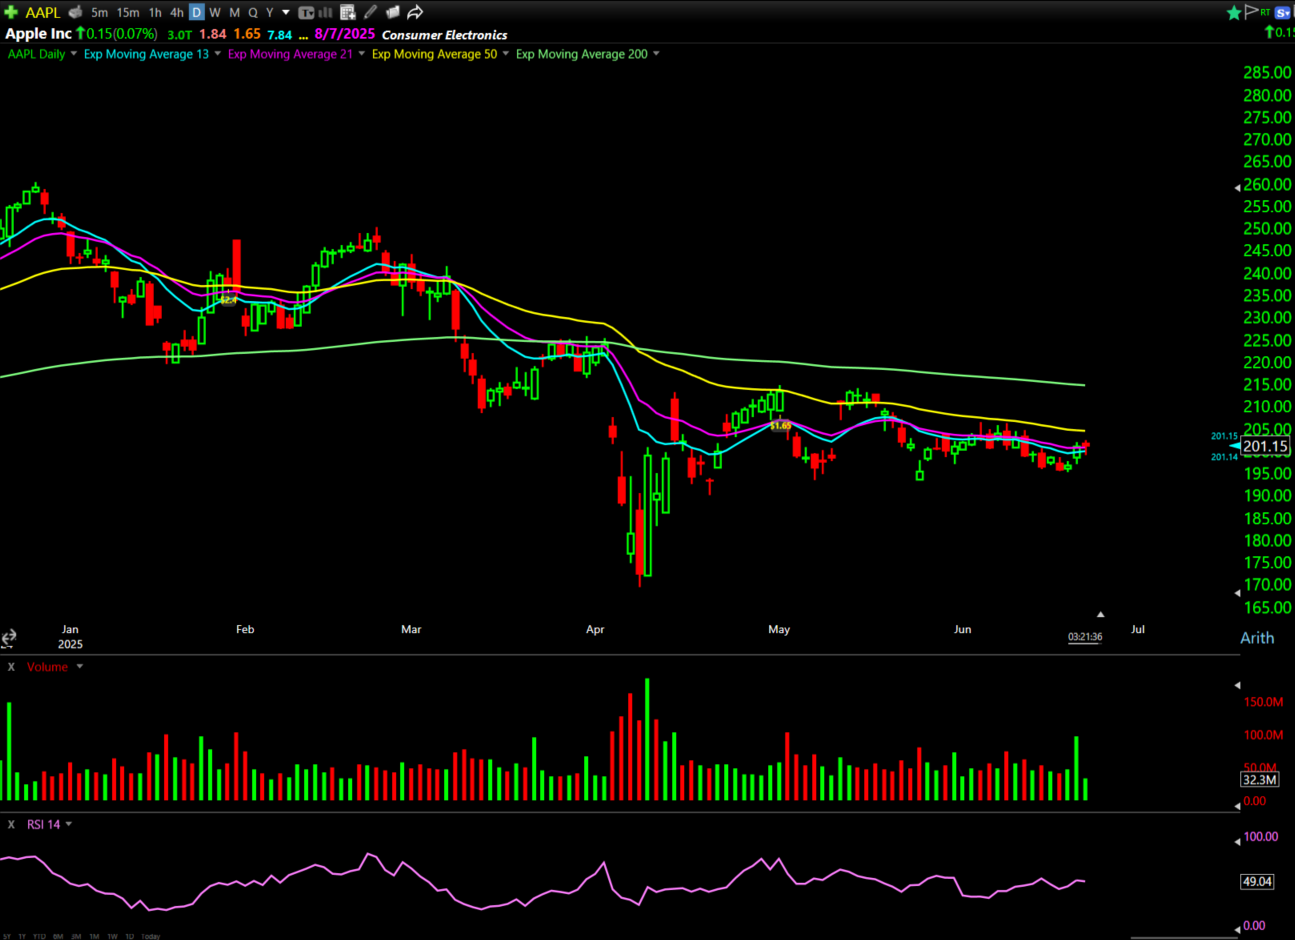
This chart shows relative strength. It’s begging for a breakout above $202.
I’ve got alerts set above that key level. If it does, the June 27 $205 calls could set up beautifully.
No one knows what’s going to happen next.
The news will be full of noise over the next few weeks. Conflicting opinions, contradictory stories, etc.
Try to tune those headlines out. Focus on the signals the market is sending you.
Happy trading,
Ben Sturgill
P.S. Last week, we alerted a 320% winner.
Don’t miss the next one…*
Join Aaron Hunziker TODAY, June 24 at 10:00 a.m. EST to pull the curtain back on this proprietary trading system.
Seats are running out fast — Get yours before it’s too late.
*Past performance does not indicate future results