Good morning, traders…
You should see my house right now…
Opened suitcases staggered across the floor. Piles of shorts and hoodies everywhere. Along with sunscreen, trail mix, and enough bug spray to fumigate a castle.
But before I head to Northern New Hampshire for a week at the lake with my family, I want to make sure you’re prepared to crush the market while I’m gone.
The indexes are pressing into all-time highs, while economic data is coming in mixed:
- GDP: Q1 revised down to -0.5% annualized (worse than expected).
- Durable Goods: Orders rose in May (showing firm business investment).
- Jobless Claims: Slight dip (but continuing claims remain elevated).
- Inflation: Core PCE slowed to 2.5% YoY (cooling but still above target).
That may sound like a dangerous combination, but the price action remains resilient.
I’m seeing clean compression, strong volume, and Smart Money flow into several pretty charts.
These are “if…then…” setups.
If the price breaks above (or below) a certain level, then I’ll trade them.
Not before. I want undeniable confirmation.
And with the 4th of July break coming up, you have a unique opportunity to mark your levels, prep alerts, and let the entries come to you.
Let’s Break Down 7 “If, Then” Setups I’m Watching On My Trip…
1. Super Micro Computer, Inc. (NASDAQ: SMCI)
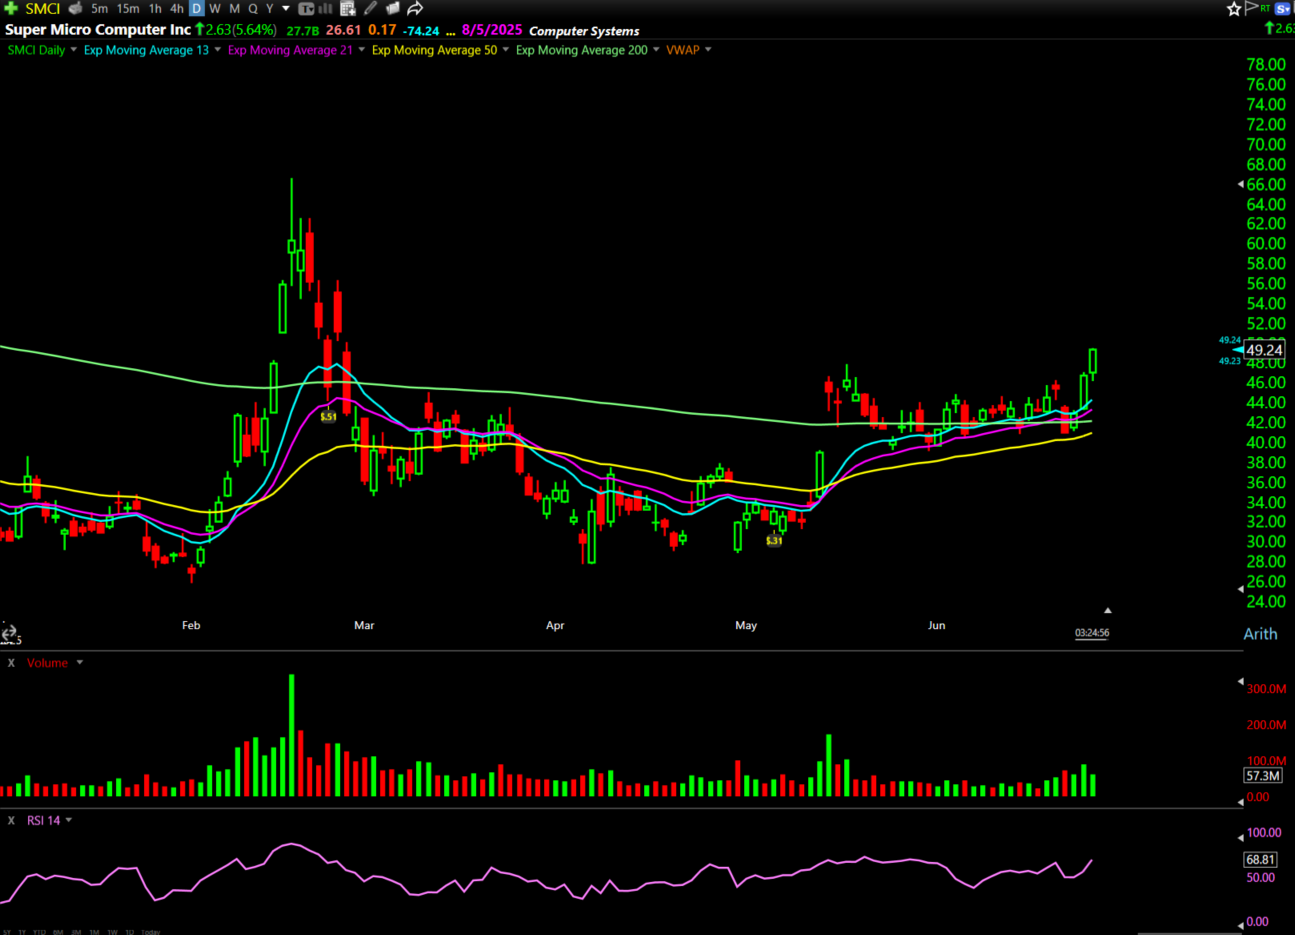
This chart is consolidating just below a key resistance level at $147.75.
The stock has been holding its range with declining volume, which often points to a possible breakout.
If the price moves above $147.75, then I’ll be watching the July 18 $50 calls for a potential directional trade.
REMEMBER: This stock had a historic short squeeze earlier this year. Former runners often run again.
2. Las Vegas Sands Corp. (NYSE: LVS)
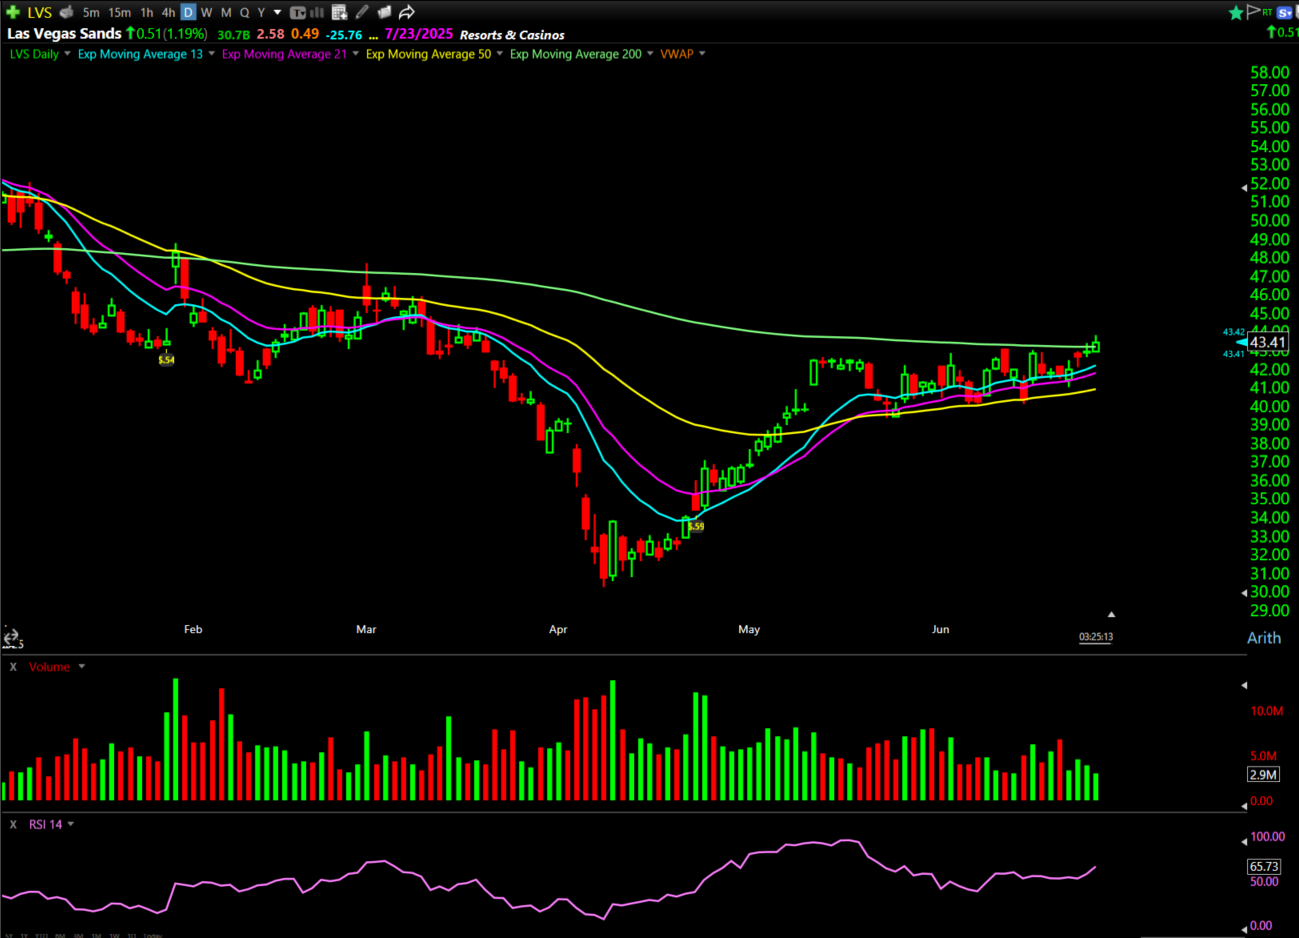
LVS is forming a clear flag pattern, with higher lows pressing into a flat top around $43.45.
There’s been consistent option flow all week, including nearly $1 million in the August $43 calls.
If $43.45 gets taken out, then I’m interested in those same August $43 calls for follow-through.
3. Verint Systems Inc. (NASDAQ: VRNT)
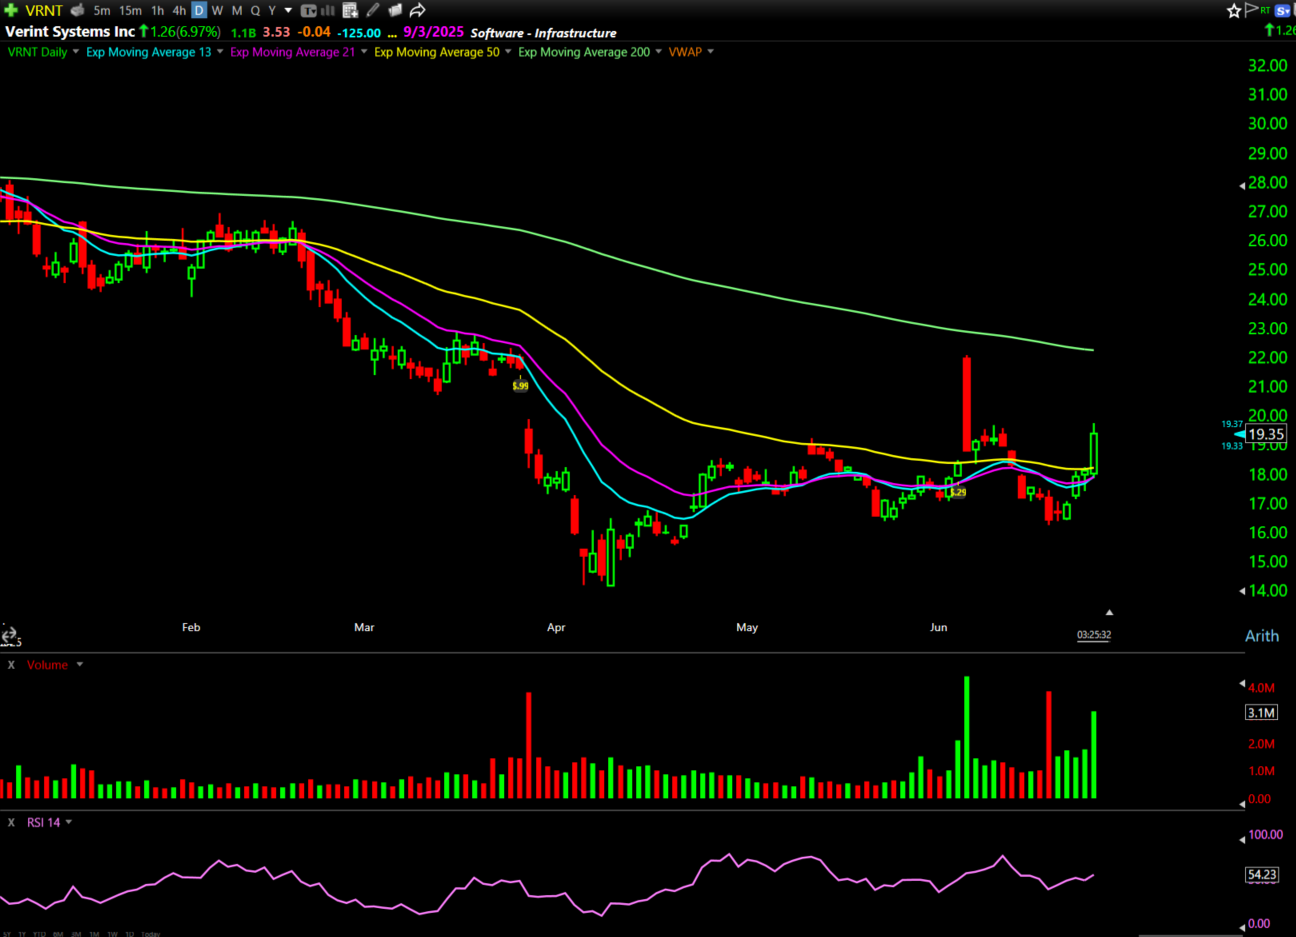
This name had huge call activity this week, going from almost no open interest to over 5,000 contracts in a single day.
If the price breaks above $18.25, then I’ll probably buy the August 15 $17.50 calls.
This is a thinner name with less trading activity. Use a small position size.
4. IREN Limited (NASDAQ: IREN)
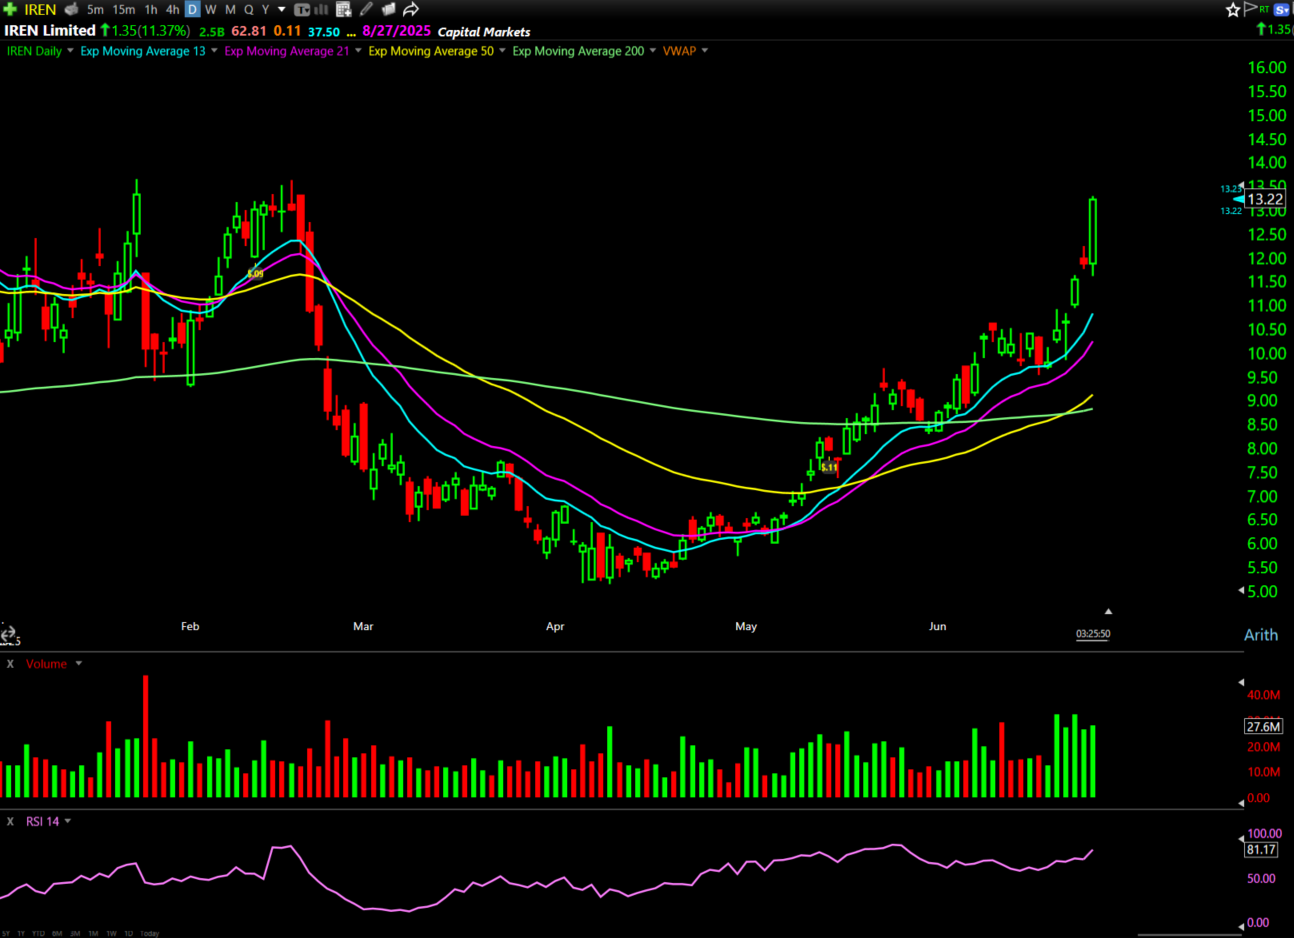
The chart is extended, but it’s pressing up against a clear breakout level at $12.35.
If it clears that, it would mark the third attempt from the same range on the weekly chart.
I’ve got my eye on September $19–$20 calls, especially if momentum kicks in.
5. Oklo Inc. (NYSE: OKLO)
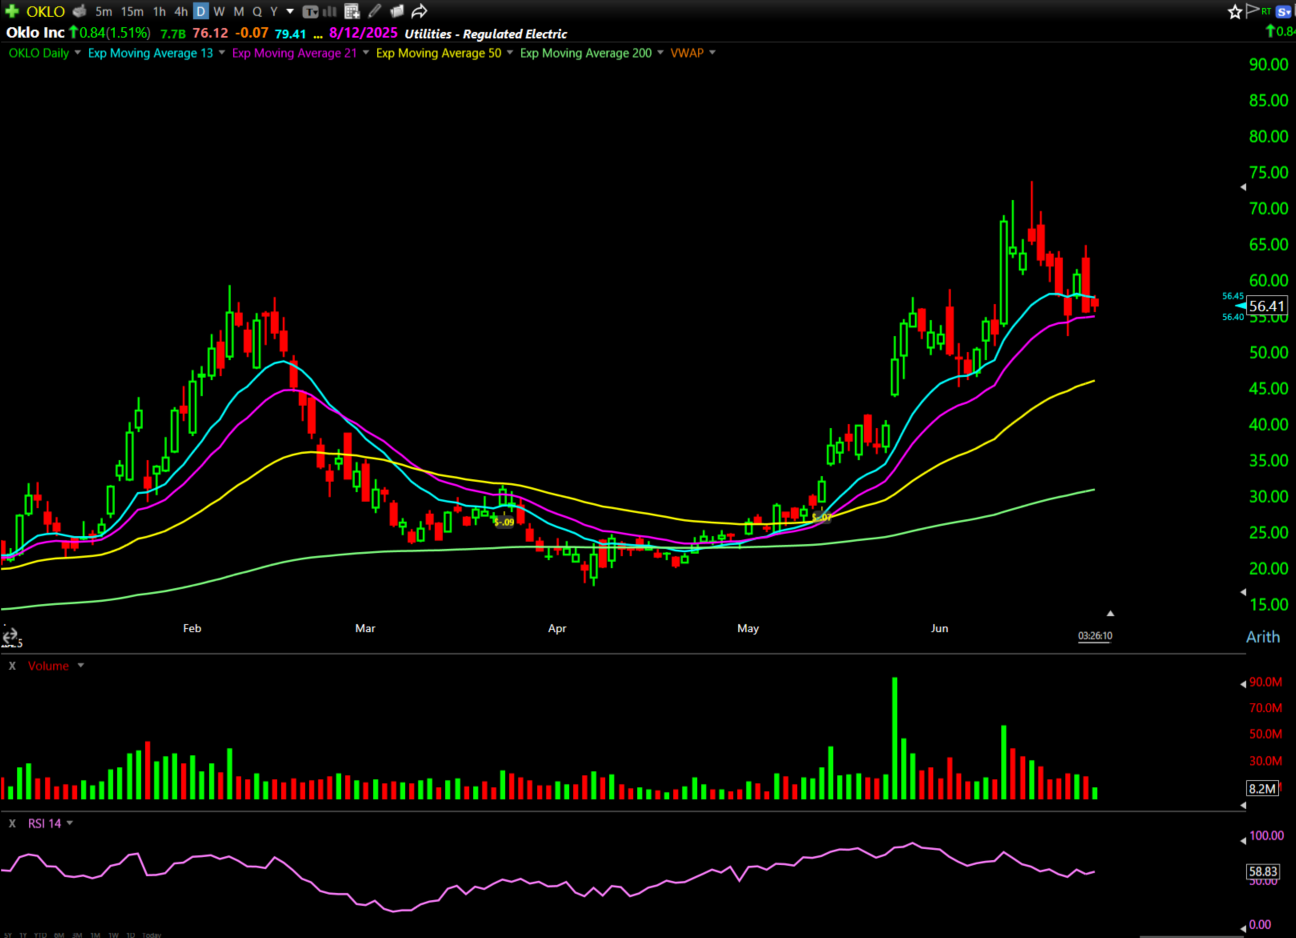
OKLO pulled right back into the support zone we’ve been watching at $37.29.
I added to my position on the pullback.
The setup still looks solid. I’ll hold this trade as long as the structure remains intact.
6. Nvidia Corporation (NASDAQ: NVDA)
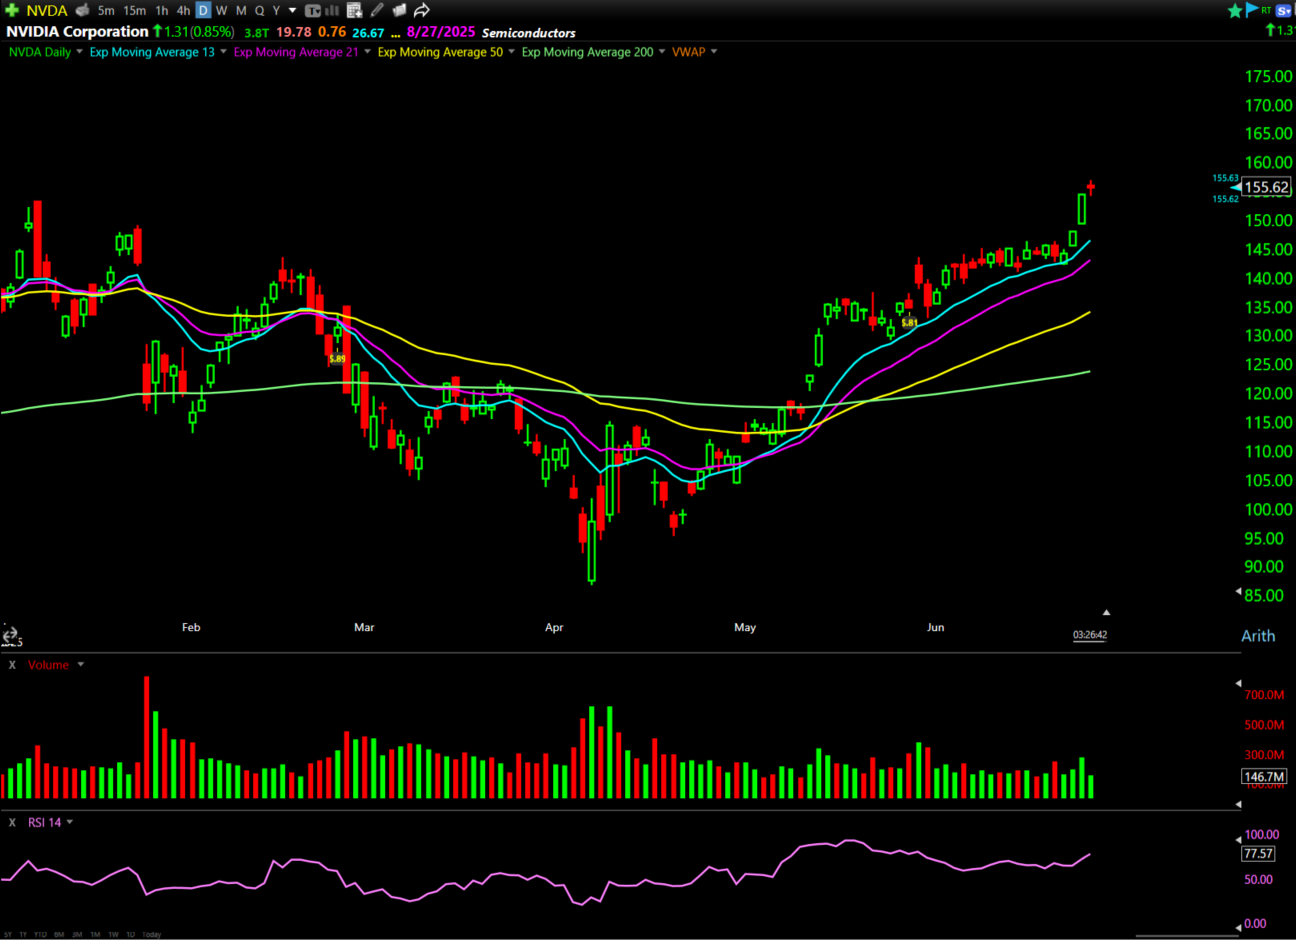
The price is extended after multiple pre-market gaps, but I’m watching for a retest of $155.
If it holds that level, then the June 27 $155 calls could offer an intriguing short-term opportunity with tight risk.
7. Meta Platforms, Inc. (NASDAQ: META)
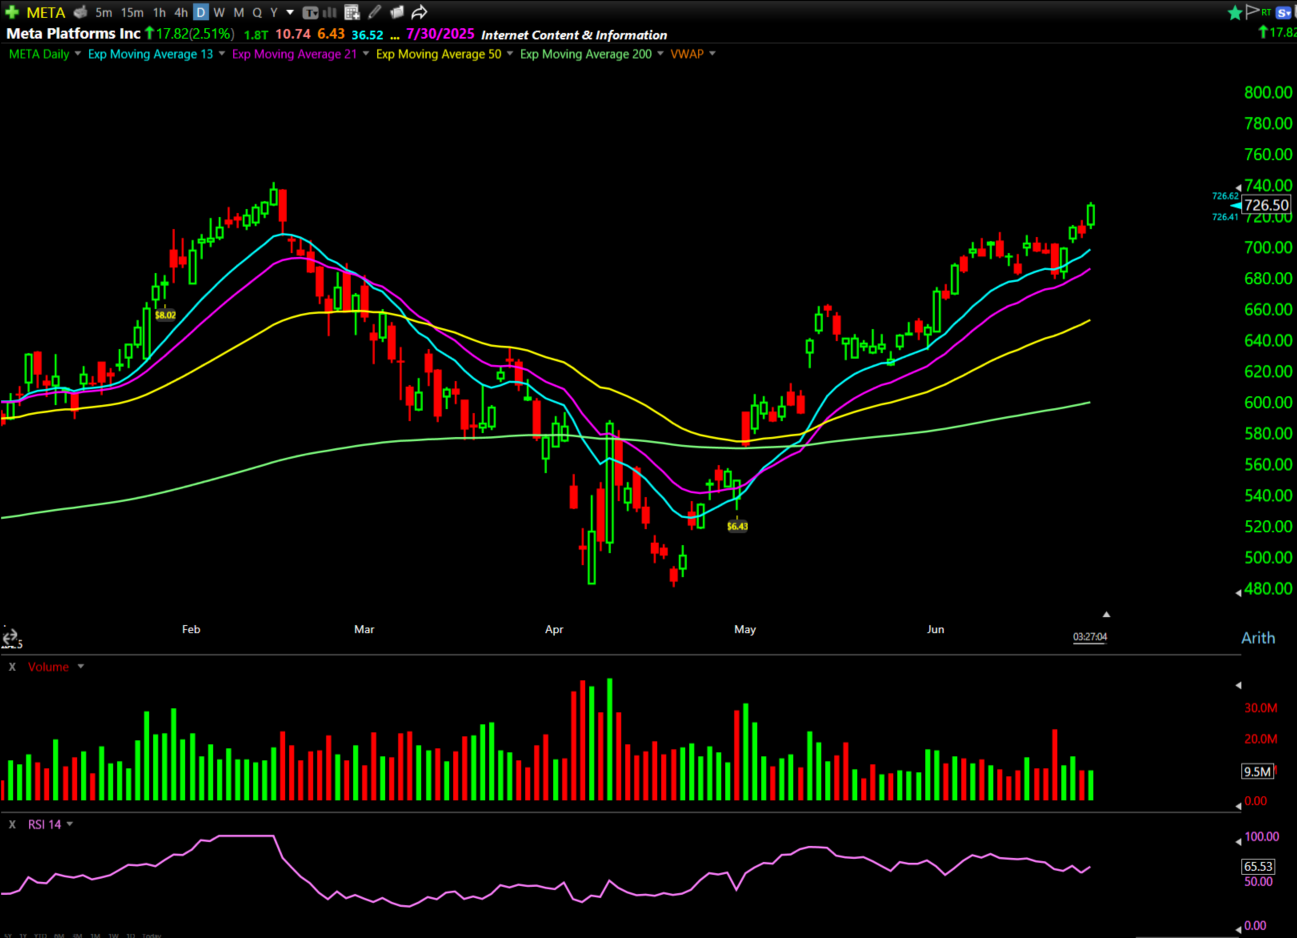
META is pressing higher, but I’d prefer to see a pullback to $700, which lines up with prior support.
If that level holds, then the July 3 $720 calls could work well into next week.
These are my favorite “if…then…” setups right now.
Wait for the “if” to happen, “then” find your entry.
I’ll be offline most of next week, celebrating my son’s 13th birthday in New Hampshire, soaking in the lake air, and enjoying the outdoors.
In the meantime, watch these charts closely, respect the key price levels, and plan your trades carefully.
Happy trading,
Ben Sturgill
*Past performance does not indicate future results