Good morning, traders…
If you don’t know who Tom Lee is, you should.
Lee is the CIO and Head of Research at Fundstrat Global Advisors. You’ve probably seen him on CNBC…
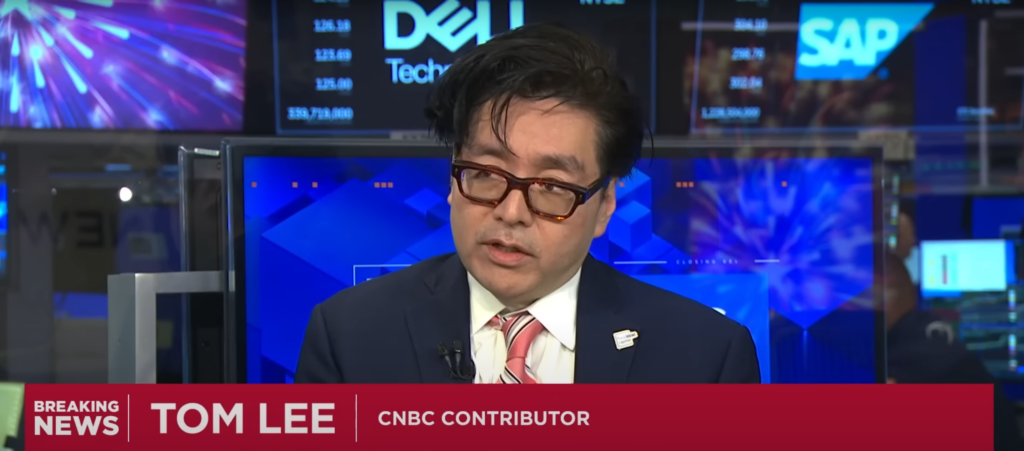
He’s easy to recognize. His glasses are a little crooked. His hair is usually wild.
But don’t let the look fool you. He’s been spot-on with every major market call in the past five years.
He called the V-shaped recovery during COVID when most traders were still panic selling.
He bottom-fished during the 2022 rate hike cycle and nailed the 2023 rebound.
He said the tariff concerns were overblown and called the rebound in April.
And last week, he joined CNBC’s Closing Bell and made a new call:
This rally isn’t over. It’s just getting started.
Let’s Break Down Why He Thinks This (And 6 Charts That Could Lead The Rally)…
Lee laid out four points:
- The Fed hasn’t even started cutting. Our rates are still above global peers. Once that changes, it could unleash a fresh wave of liquidity.
- Valuations should be higher. The market has survived five big shocks: COVID, supply chains, inflation, rate hikes, and war. Companies have earned a re-rating by surviving.
- Tariff pressures are fading. Earnings estimates haven’t caught up yet. If trade flows improve, the upside surprise could be big.
- Institutions are underweight. Lee says this is the most hated V-shaped rally he’s ever seen. There’s $7 trillion sitting in money markets. If the Fed cuts or macro headlines ease, that cash doesn’t stay idle. It floods in as funds scramble to keep up with benchmarks.
That last point is the most crucial. Hedge funds are trailing. They missed the move.
And when funds lag the benchmark index, they must buy aggressively to keep up with the rally.
Put it all together, and Lee’s thesis holds.
This isn’t a frothy, overbought market. It’s cautious, under-positioned, and primed for more upside.
Here are six charts I’m watching for further upside…
Celsius Holdings Inc. (NASDAQ: CELH) – July 11 $49 calls
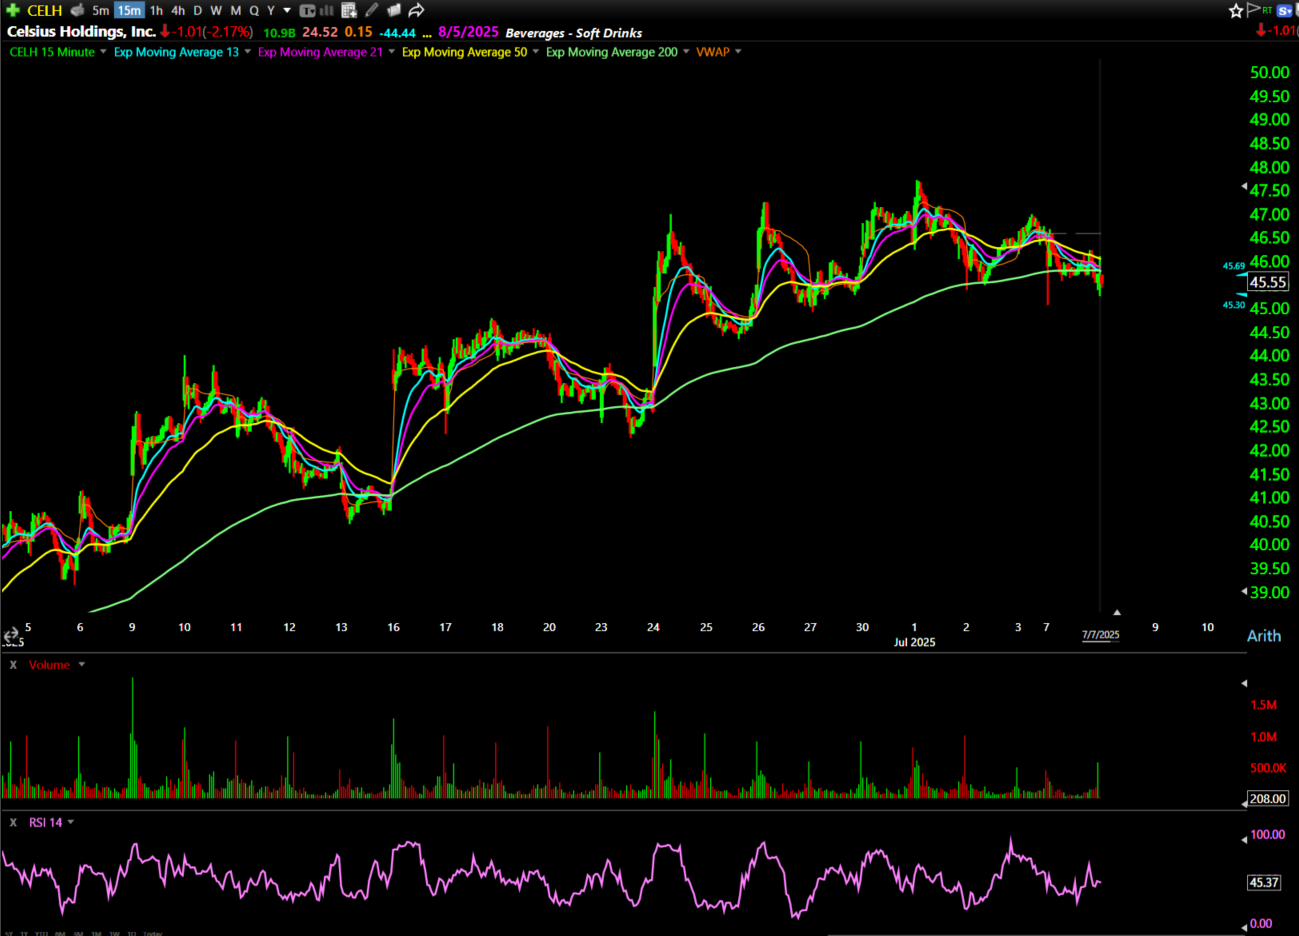
Keep an eye on the 15-minute chart. A clean consolidation and hold above $47.30 could trigger a sharp move. That level matters.
Unity Software Inc. (NYSE: U) – July 11 $27.50 calls
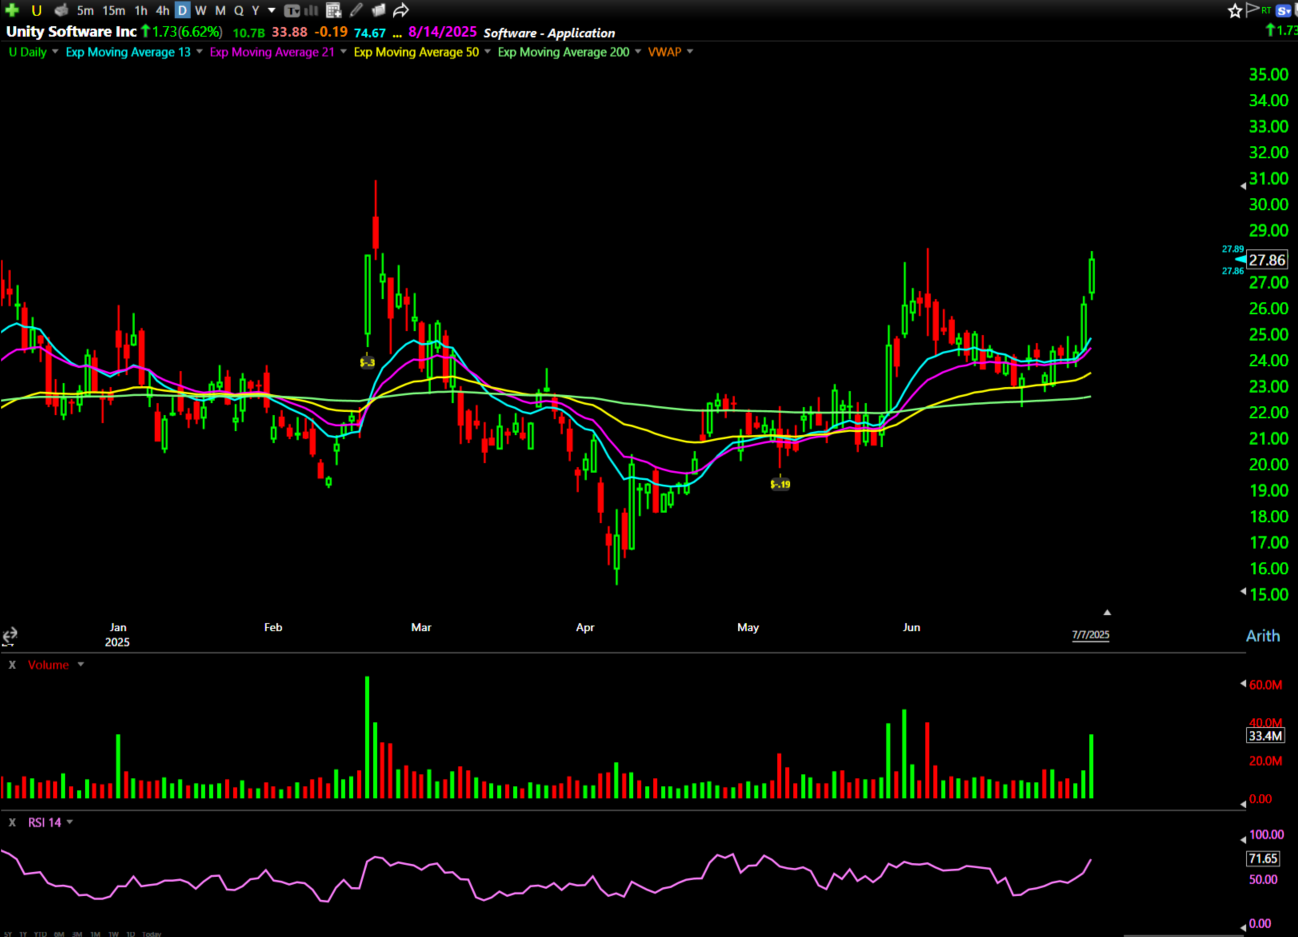
The chart shows a nice pennant or bull-flag pattern forming above roughly $26.45. If it breaks, it can run.
Celldex Therapeutics Inc. (NASDAQ: CLDX) – August 15 $22.50 calls
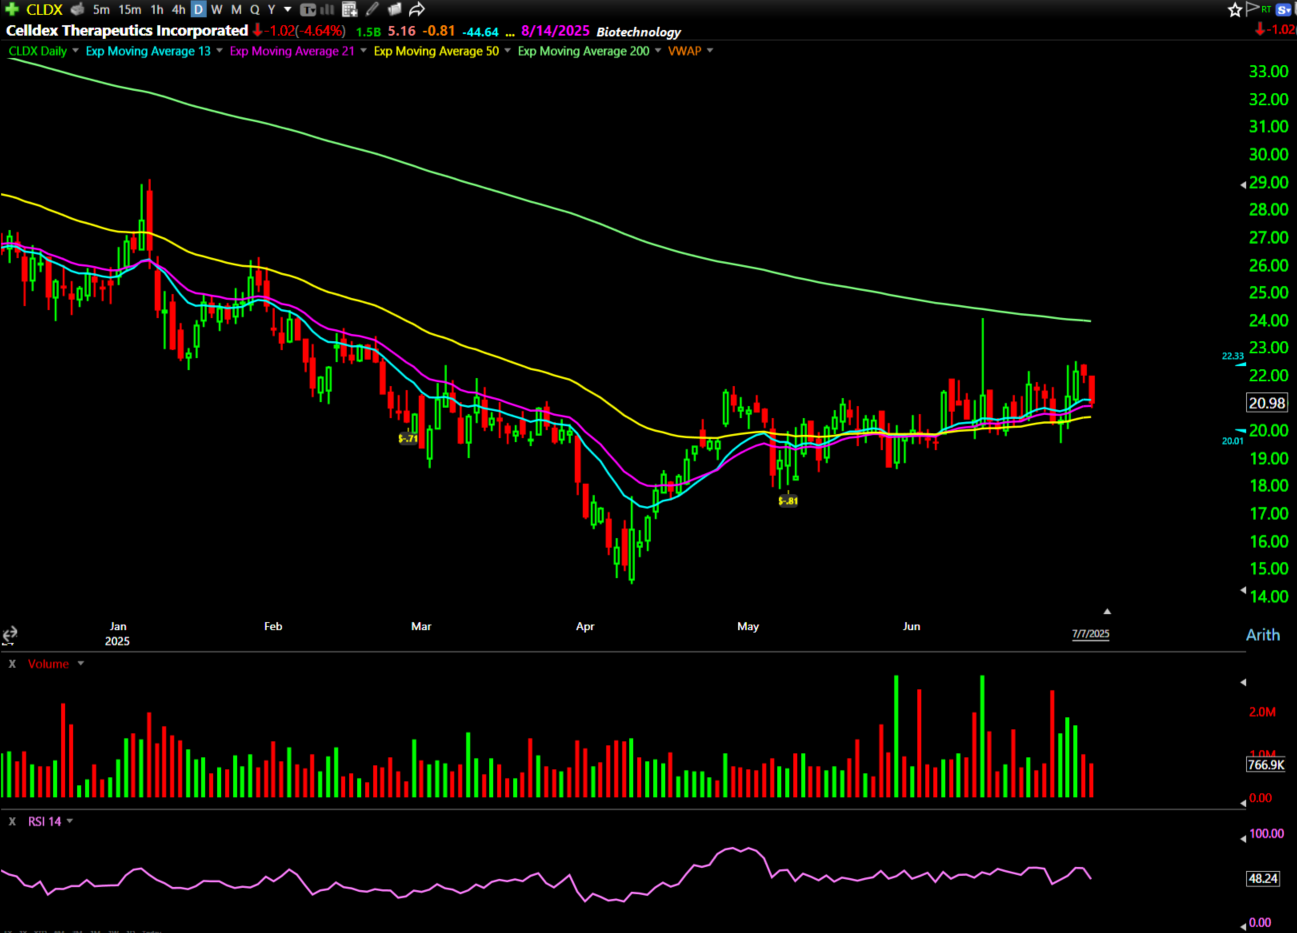
Looks like a textbook cup-and-handle breakout on the daily chart. I’m watching for a move above $22.50 to confirm.
Rigetti Computing Inc. (NASDAQ: RGTI) – September 19 $15 calls
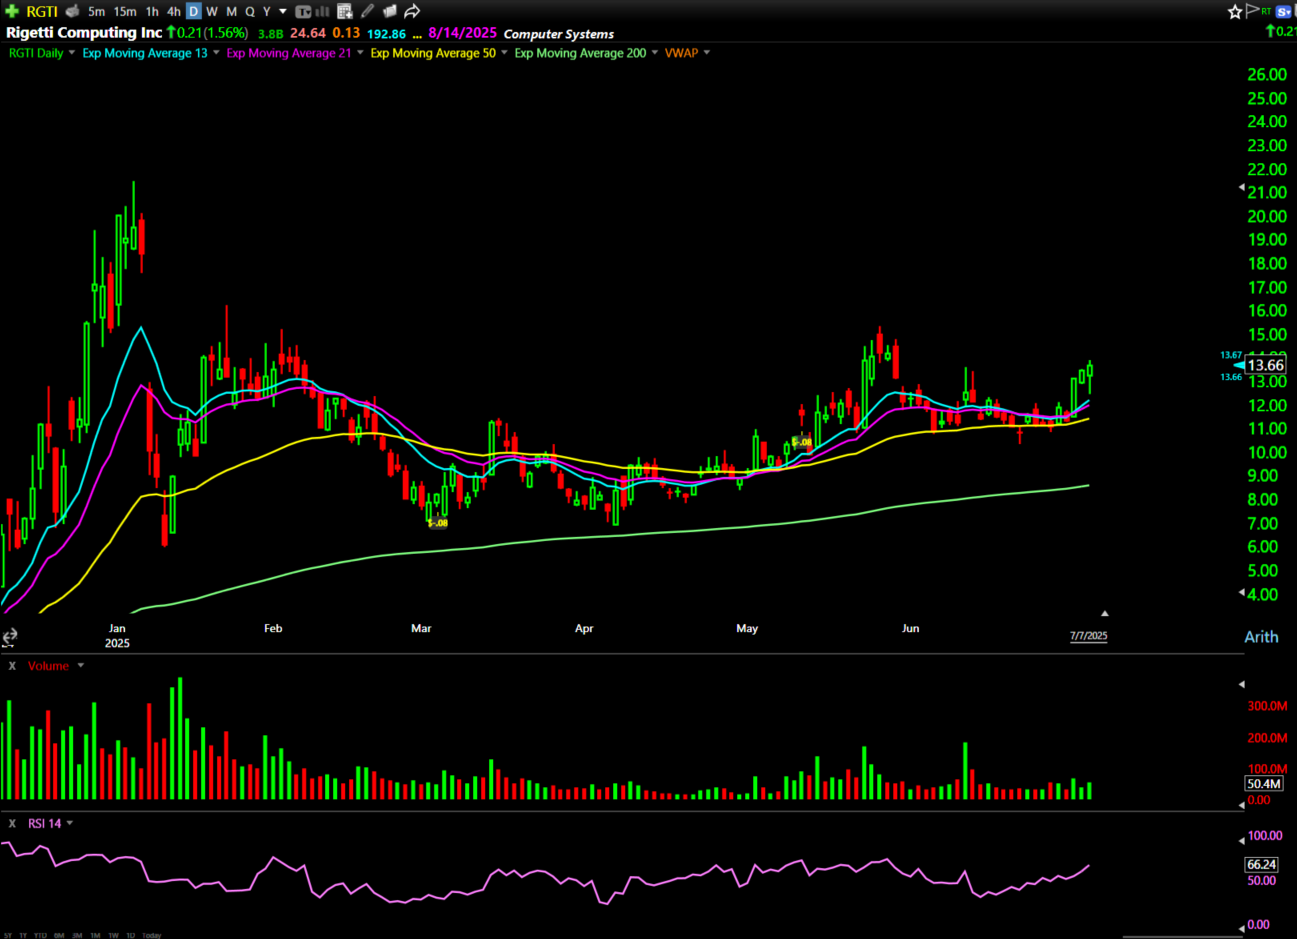
This quantum stock has a tight weekly/daily pennant. Set an alert at $13.25. That level could spark a serious move if it breaks out.
Nvidia Corporation (NASDAQ: NVDA) – July 11 $160 calls
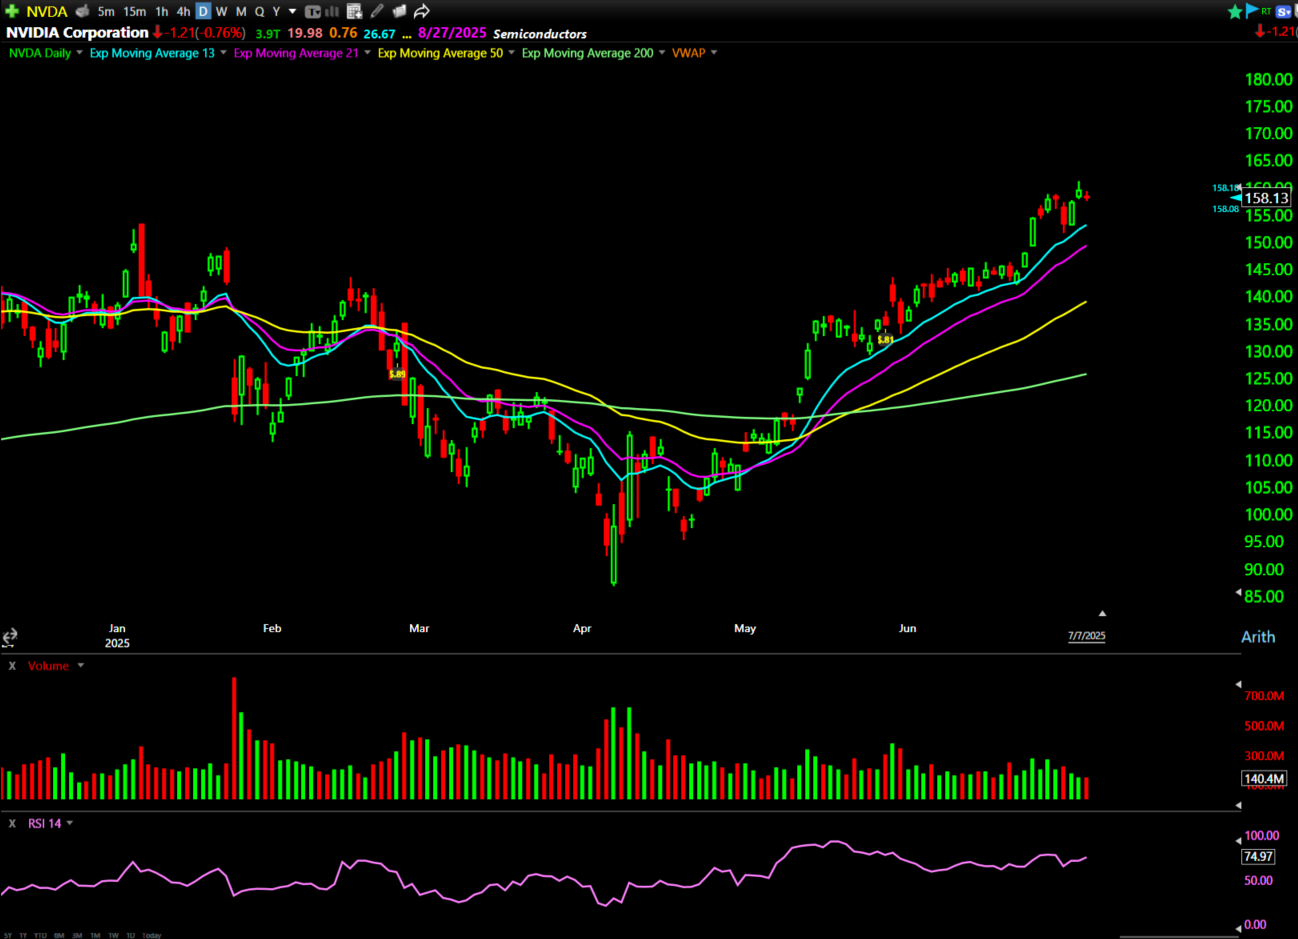
Here’s the play: stay above the $58 strike on the intraday chart, and if it breaks $59.50, the move could extend toward $63.
Broadcom Inc. (NASDAQ: AVGO) – July 11 $280 calls
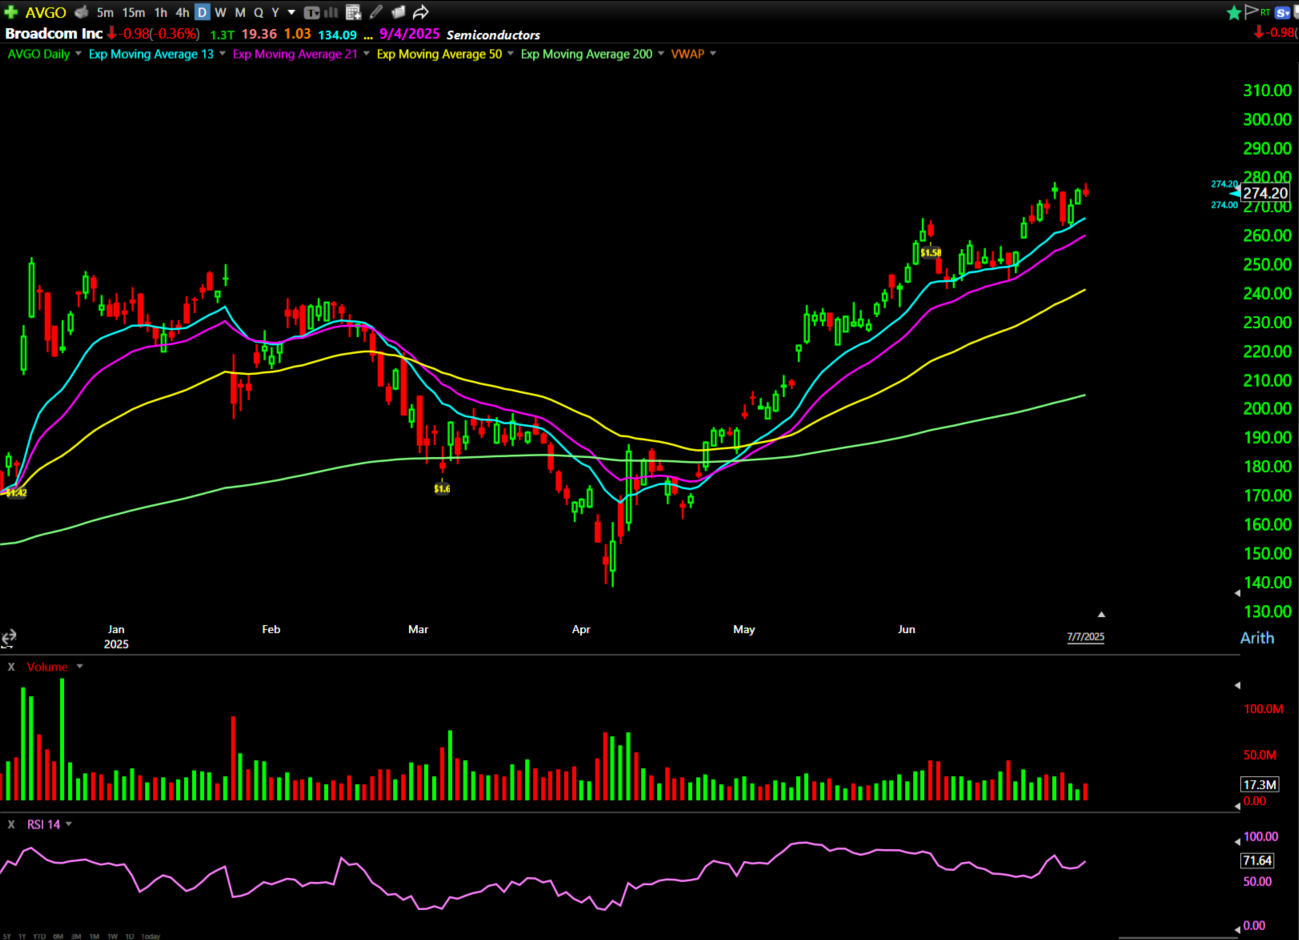
Watch the flag formation near $275. A break above will give us a clear entry signal.
I agree with Tom Lee, this rally has room to run. And these setups are my favorites to play it.
Happy trading,
Ben Sturgill
P.S. Since launching my OMEN Scanner, I’ve achieved an 89% win rate with a 72% average gain…
My top 120 trades have all generated 100% or higher. 27 soared above 200%, and 12 exploded beyond 300%…
But my biggest trade yet could be setting up RIGHT NOW.
Join Danny Phee this THURSDAY, JULY 10 at 7:00 p.m. EST for a LIVE WORKSHOP where he’ll go over our best trade ideas in the options market.
Stop missing triple-digit wins — Click here to sign up before it’s too late.
*Past performance does not indicate future results