Good morning, traders…
We’ve all heard the famous phrase, “You can’t judge a book by its cover.”
But you might not realize this saying has a parallel in trading:
You can’t judge the market from the charts alone.
Monday morning started like any other…
I woke up, opened our chat room, and pulled up my charts.
Index futures were basically flat. SPY had dipped premarket, then worked back up toward the prior day’s highs. Nothing dramatic.
But underneath the surface, the options flow was absolutely screaming.
I saw massive call orders hitting big-cap tech, unusual positioning in Nike, and uranium stocks getting heavy volume.
This is how I build my watchlist every single day. By asking a few questions:
Where are institutions placing big bets? What strikes are getting hammered? What expirations are they using?
Then I map that flow onto technical levels and time horizons to figure out which setups are worth trading.
It’s about finding a combination of indicators all pointing you to the same place.
This week, those steps have led me to four setups I never would’ve discovered if I hadn’t followed the Smart Money.
Let’s break down each setup (and show you exactly how I found them)…
Amazon.com, Inc. (NASDAQ: AMZN)
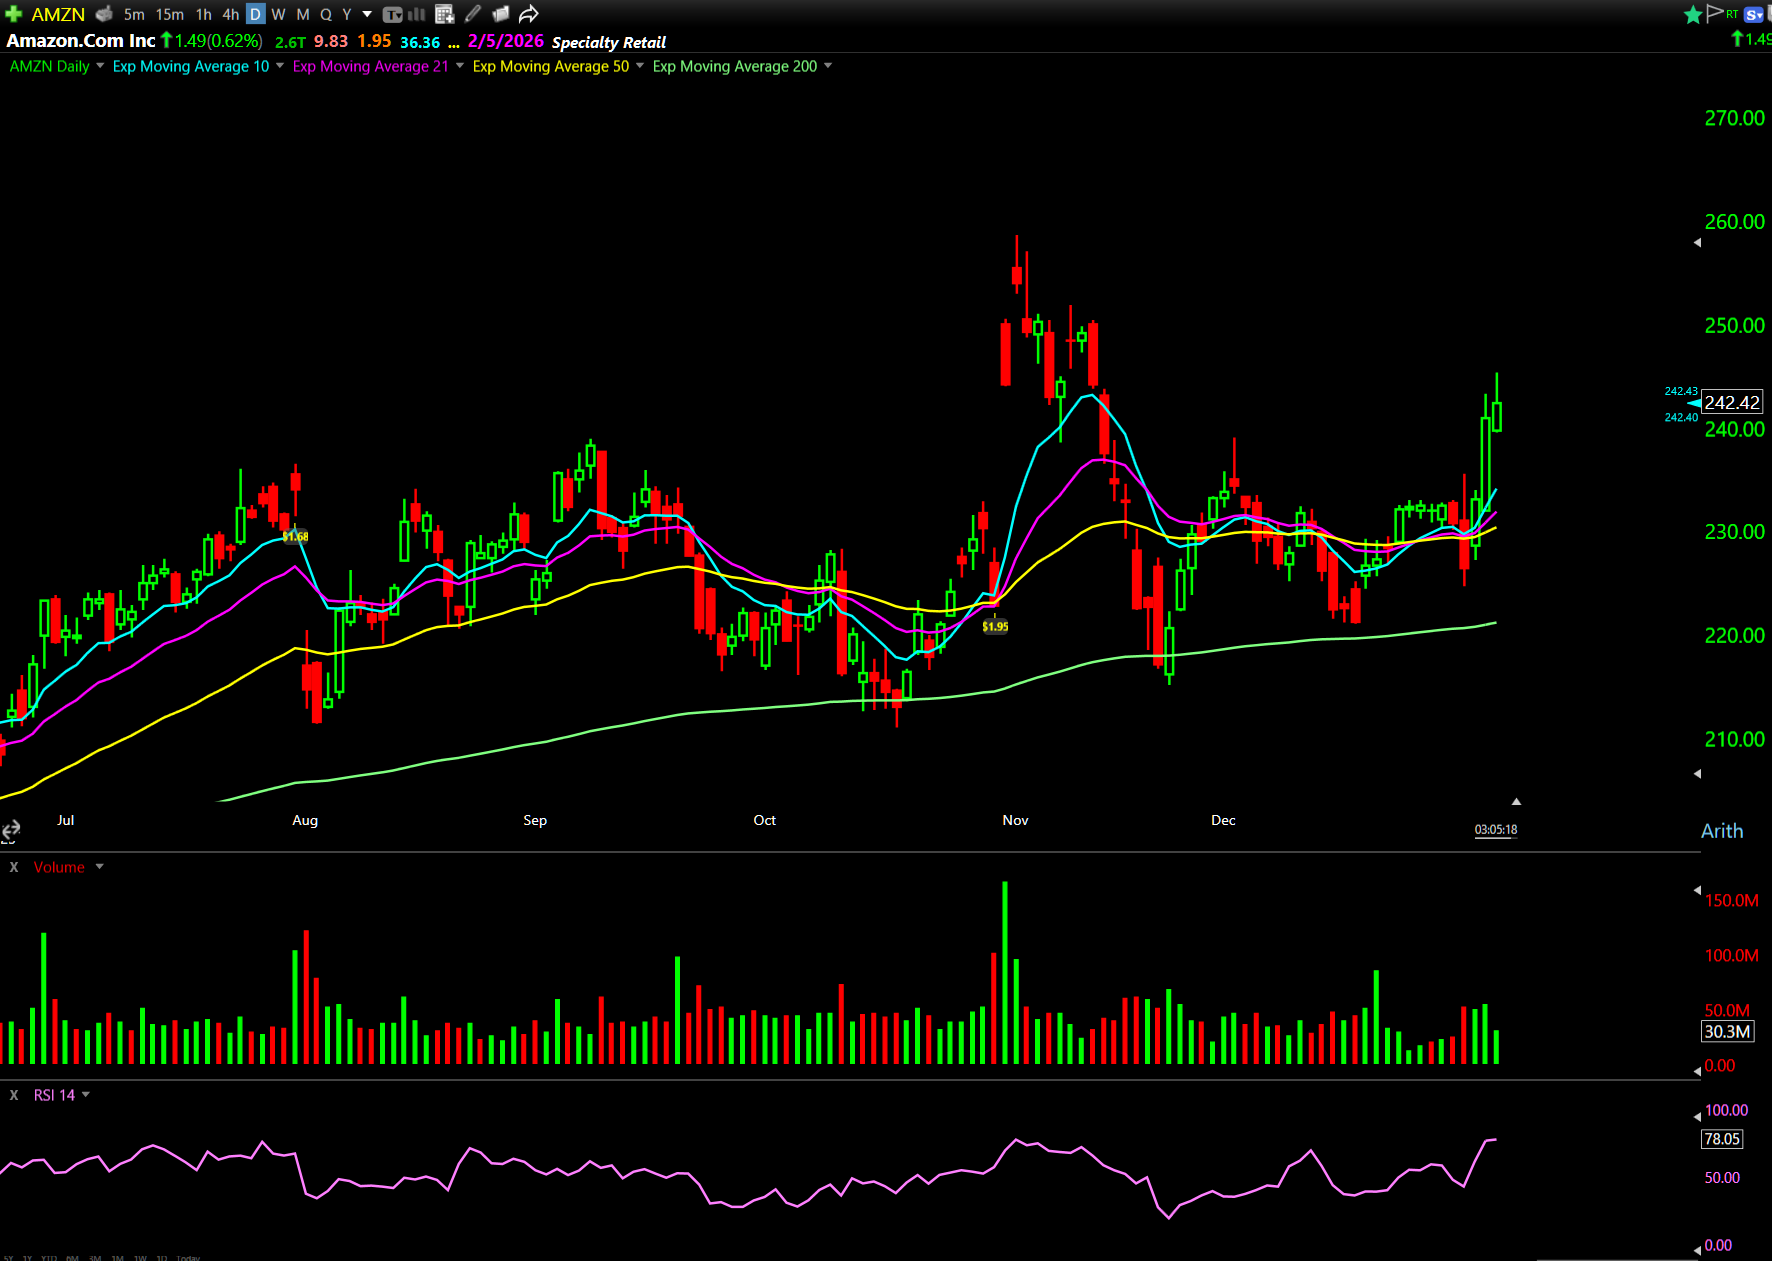
I’m always watching Amazon. It’s one of my favorite companies.
You should see my kitchen table. It looks like an Amazon sorting center most days.
But it really caught my attention about five minutes before the close on Monday.
A massive out-of-the-money call order hit the tape: June 18 $310 calls with roughly $6.6 million in premium.
I checked the chain. Open interest jumped from around 4,000 to approximately 22,000.
That’s a 5.5x increase in one day.
Translation: A Smart Money trader with serious capital thinks Amazon will hit all-time highs by June.
This is setting up a multi-month swing, perfect if you’re too busy to monitor charts all day.
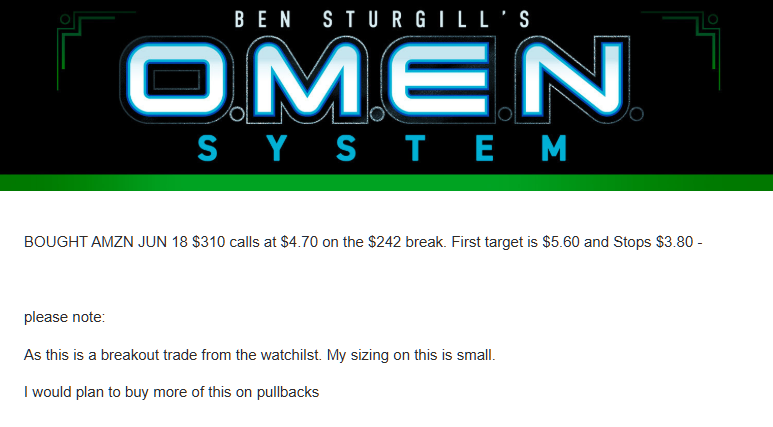
Key level at $242. If Amazon holds above that level and continues consolidating, these calls are setting up for some serious upside.
I bought them yesterday and emailed my students the plan:
Nike Inc. (NYSE: NKE)
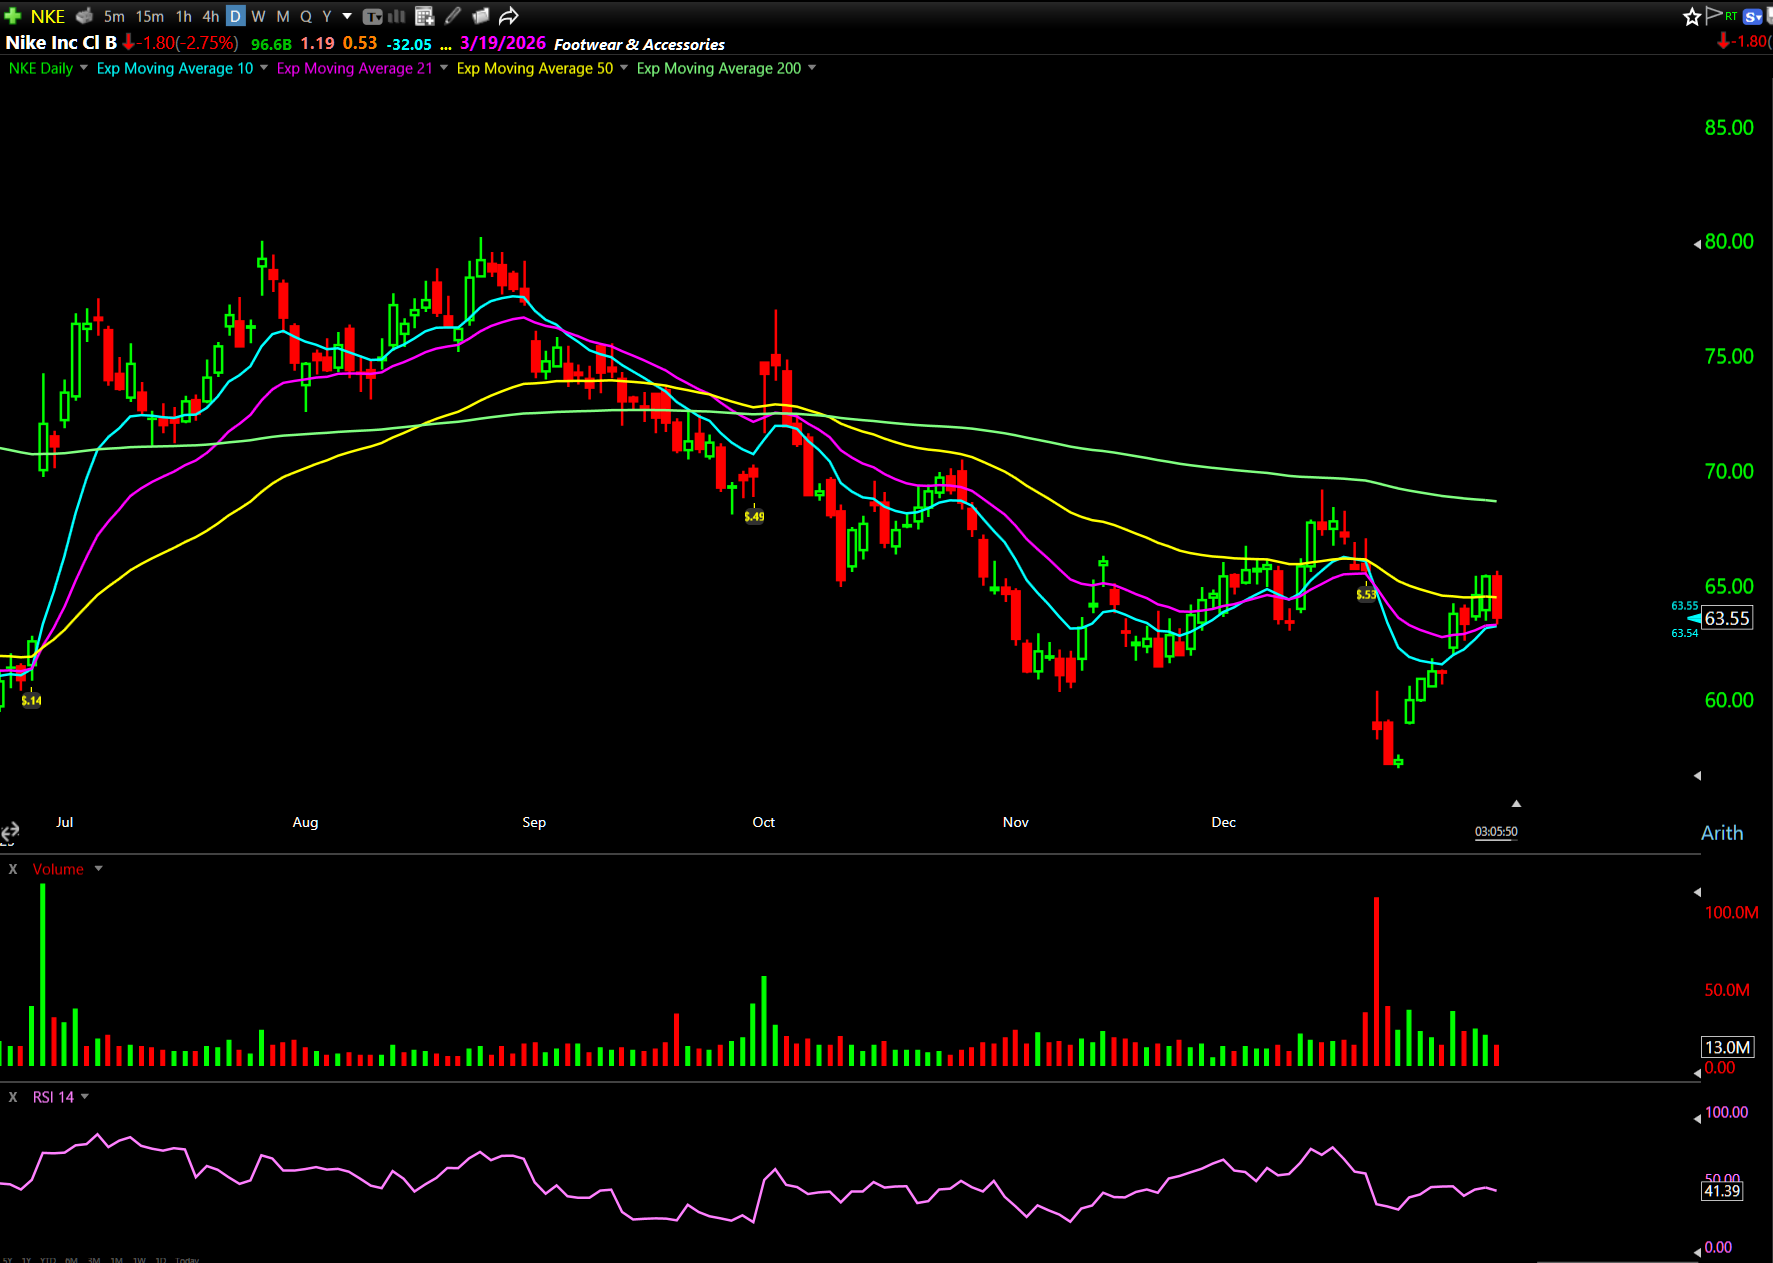
The Smart Money keeps hammering Nike calls.
But the chart’s stuck in a double-top resistance pattern.
The key level is $65.42, a clearly defined top.
If Nike breaks above $65.42, my target zone is $66-$67 on the January 9 $67 calls.
Nike tends to trade well on breakouts. When it clears resistance, it can move fast.
Don’t believe me? Just look at my 100% win from last week…*
PDD Holdings Inc. (NASDAQ: PDD)
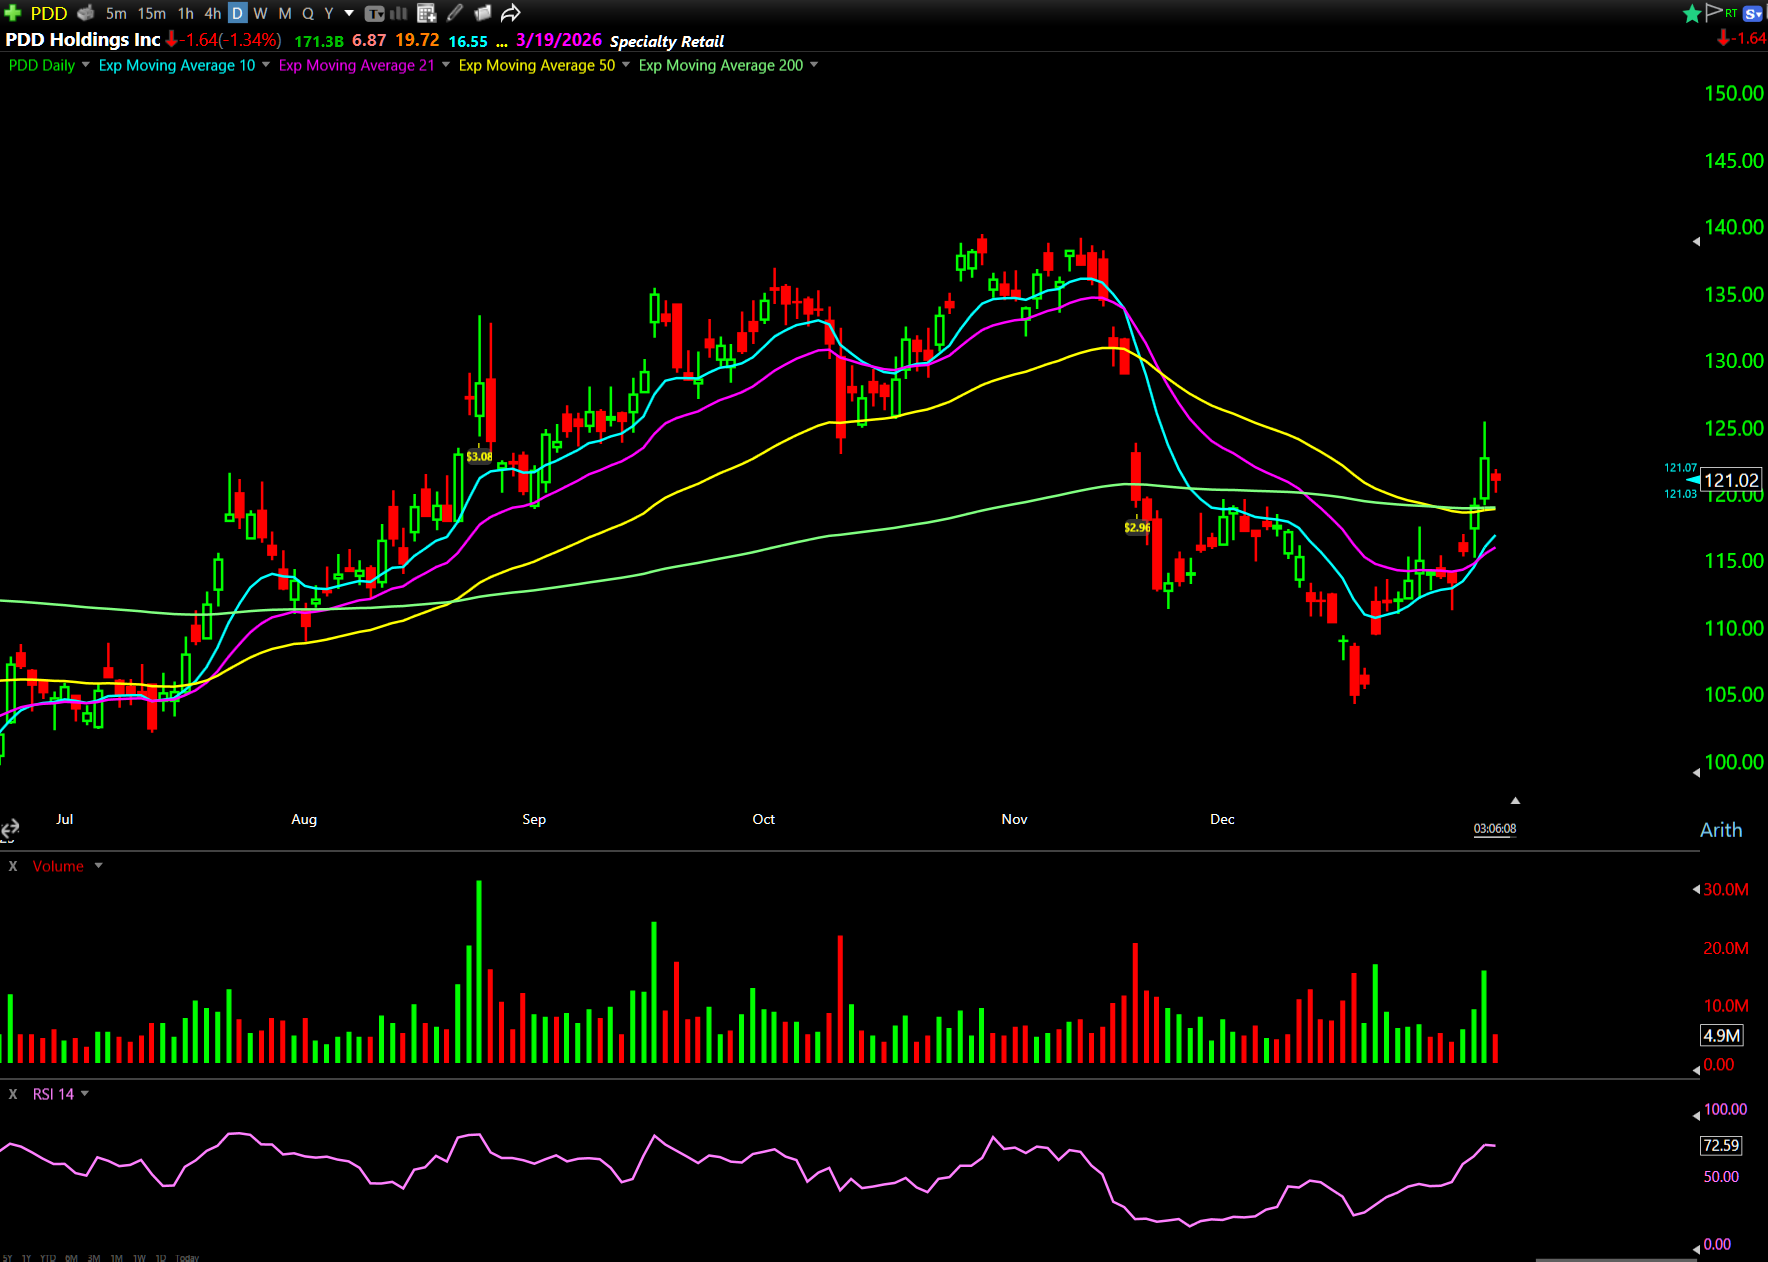
Chinese tech stock PDD hit my scanner this week with multiple massive call orders.
Freedom Capital recently raised its price target to $170, which could be a catalyst for the call buying.
This setup centers on a large gap with low volume that needs to be filled.
When the share price breaks through gaps, the moves can be explosive…
I’m seeing a 2-stage breakout structure.
Stage 1: Break the first resistance level.
Stage 2: continuation or a possible pullback before the next leg.
The January $127 strike is getting heavy flow. Some longer-dated April contracts are also showing unusual activity.
First target is around $125, then $127.
WARNING: China names are more “linked” and “correlated” than U.S. tech stocks. If BABA sells off, PDD usually follows. Watch the sector, not just this stock.
Uranium Energy Corp. (NYSEAMERICAN: UEC)
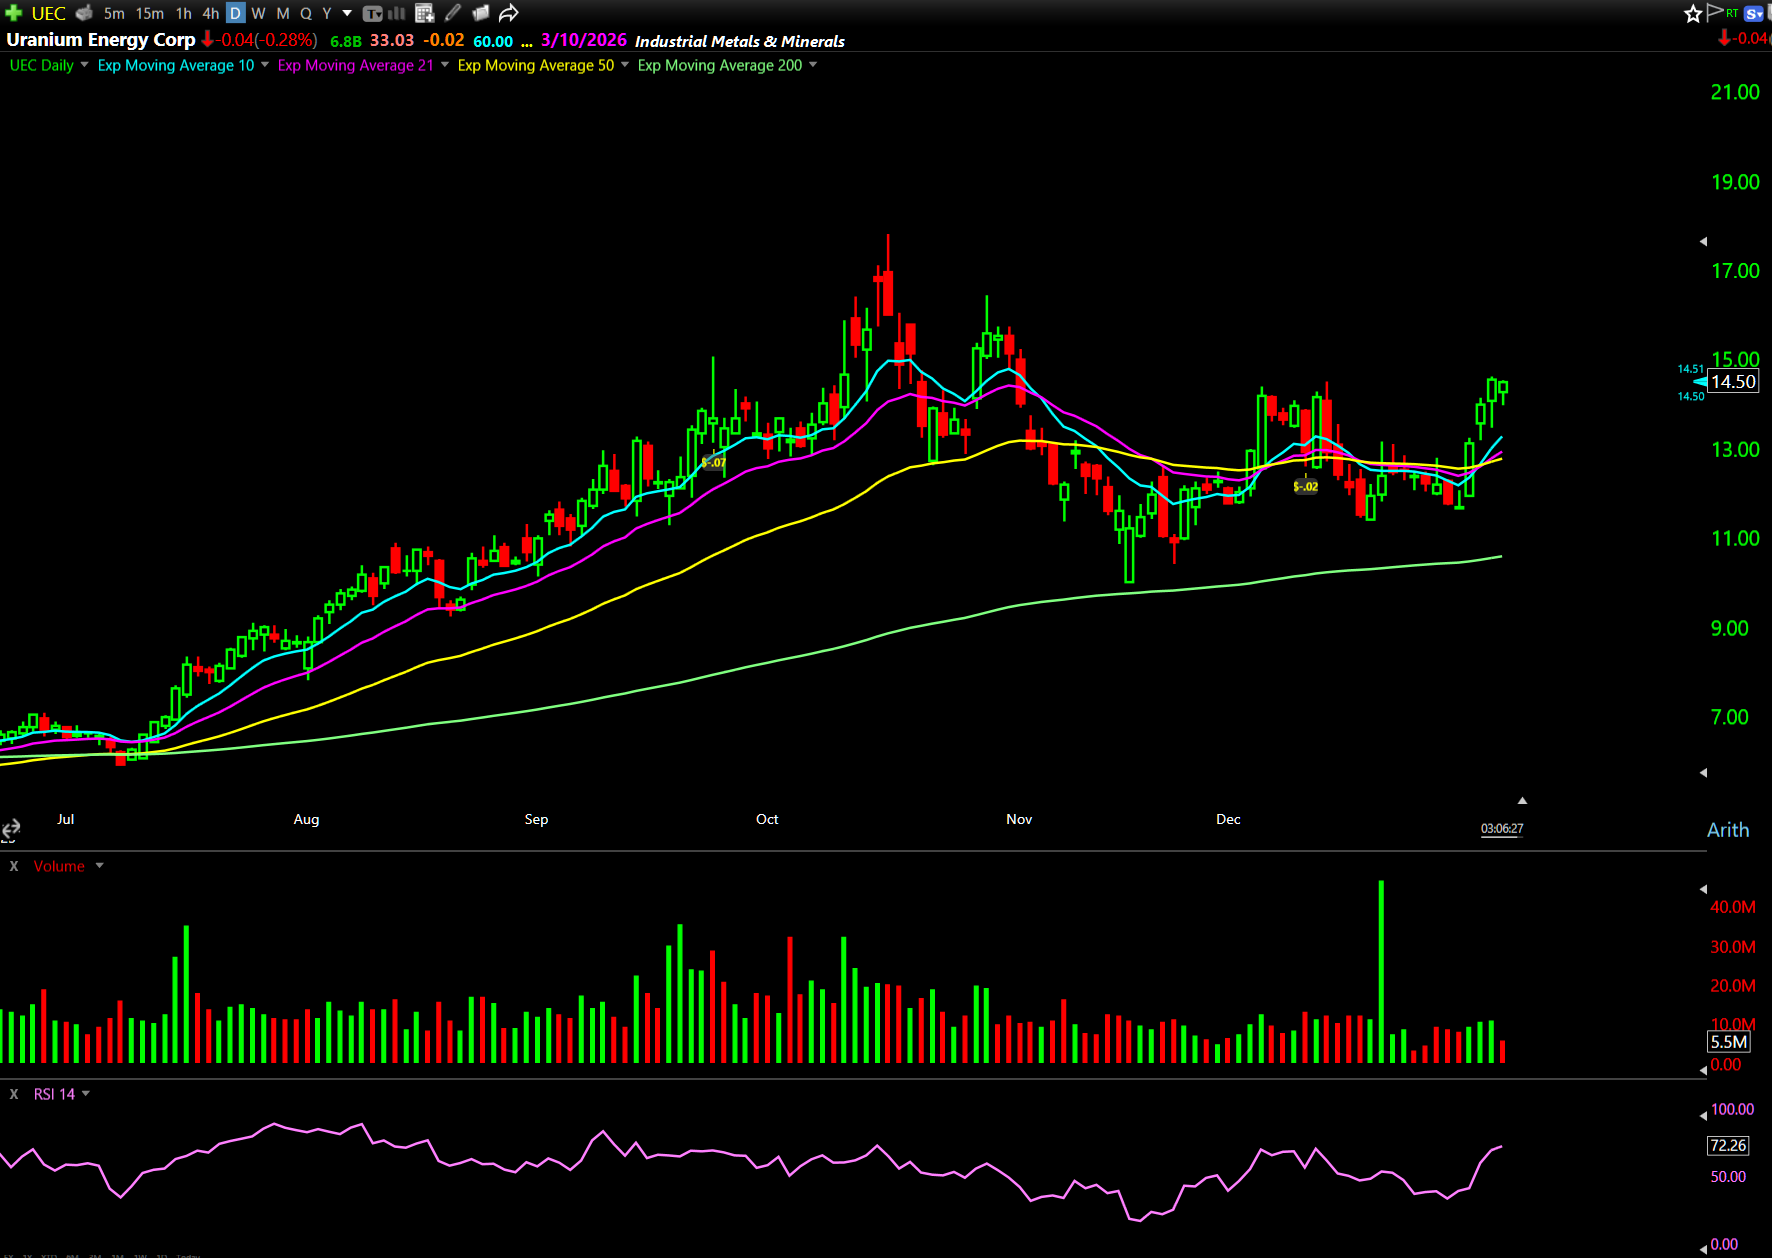
Commodities are all the rage right now. Gold, silver, palladium, copper (and now uranium) are in parabolic uptrends.
UEC has already broken out, but that doesn’t mean the trade’s over.
I’m looking for continuation (or a possible retest of support) before the next push.
Uranium names can be extremely volatile, and leadership rotates constantly.
One day it’s UUUU, the next day NXE launches. CCJ is the sector leader, but less volatile than the smaller names.
Why UEC now? The chart has a clean structure. The breakout held. Volume confirmed.
If it retests support and holds, the next leg higher is in play.
How Smart Money Trading Gives You An Edge
I have to mention this because it’s insane…
A certain small-cap stock (that I won’t name here) was up nearly 50% premarket on Monday after massive late-day call buying on Friday.
The timing was perfect. The size was huge. The calls were short-dated.
What does that tell you?
Someone had non-public information before the move happened.
That’s illegal, but it still happens. And it’s why tracking Smart Money options flow gives you an edge.
You can benefit from their insider information without breaking any rules.
I go through the same process every morning:
- Scan premarket and sector tape.
- Identify unusual option orders.
- Map them to clean trigger levels and time horizons (patient swing vs. day trade).
- Enter only if/when the trigger level confirms.
Yesterday’s flow gave me four actionable setups: Amazon for a long swing, Nike for a day trade breakout, PDD for a gap fill, and UEC for commodity continuation.
Not every setup triggers. Not every trade works.
But when you see 50,000 call orders stacking up right before a stock explodes, you’re watching insiders position ahead of the news.
And that’s one of the highest-probability moments to enter.
Start using the same scanner I run every morning to find these setups in real-time.
Happy trading,
Ben Sturgill
*Past performance does not indicate future results