Good morning, traders…
Choppy conditions are back.
Gold and silver saw their biggest single-day drops in history, Bitcoin (BTC) is tanking, and the government is partially shut down.
The all-important SPDR S&P 500 ETF Trust (NYSE: SPY) had a deep pullback on Thursday, but quickly bounced back (right off the level I previously alerted).
To add to the swings, earnings season is heating up.
Advanced Micro Devices Inc. (NASDAQ: AMD) on Tuesday, Alphabet Inc. (NASDAQ: GOOGL) on Wednesday, Qualcomm Inc. (NASDAQ: QCOM) on Wednesday, Amazon.com Inc. (NASDAQ: AMZN) on Thursday, Roblox Corporation (NYSE: RBLX) and MicroStrategy Inc. (NASDAQ: MSTR) later in the week.
Choppy conditions, a stacked earnings slate, and commodity volatility are all coalescing.
So how do you trade it?
I’ve been using one specific indicator…
It’s telling me exactly when stocks are overextended (and when they’re due to bounce back).
And reading it correctly can be your secret weapon.
I’m going to show you how this indicator works, what it’s saying about where the market’s headed, and which setups it’s leading me to.
This 1 Indicator Can Help You Weather The Choppy Conditions…
Bollinger Bands: The Big Tell In This Market
Bollinger Bands are the best technical indicator in this market. Period.
The indicator shows you two outer “bands” that sit a certain number of standard deviations away from the share price:
See how reliable those boundaries are?
If it gets towards the top band, it usually pulls back. If it gets towards the bottom band, it usually bounces.
When the share price extends beyond the bands, it’s almost always due for a reversal back to the mean.
Anytime a chart you’re watching starts trading meaningfully above or below the bands, it’s time to pay attention…
Bitcoin (BTC)
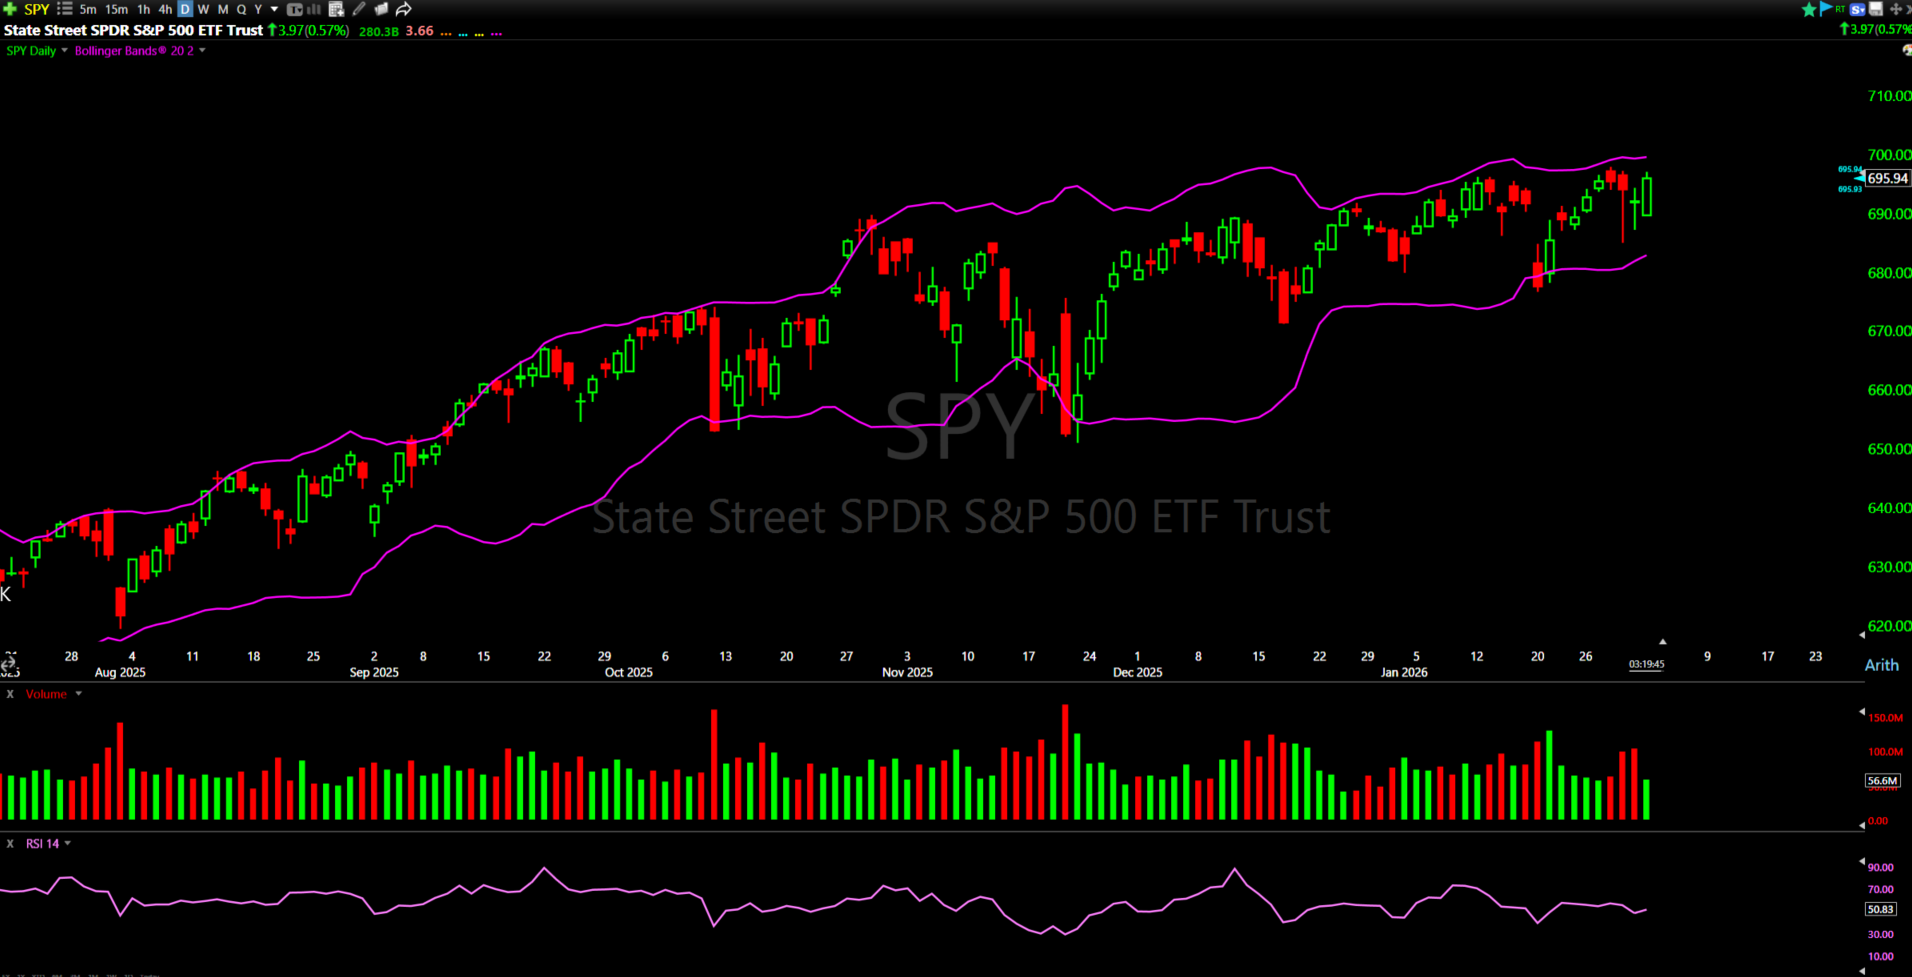
Look at Bitcoin (BTC)’s daily chart with Bollinger Bands:
The price is way below the bottom band.
We’re at a negative three standard deviation…
Translation: It’s probably trading too low.
The pattern is clear: every time we hit negative three standard deviations, we get a bounce.
And the price is nearing a key support level from April 2025.
That’s why I had limit buys sitting down at $75,000. Because I’m expecting a reversal back up into the bands.
This is how Bollinger Bands can provide setups.
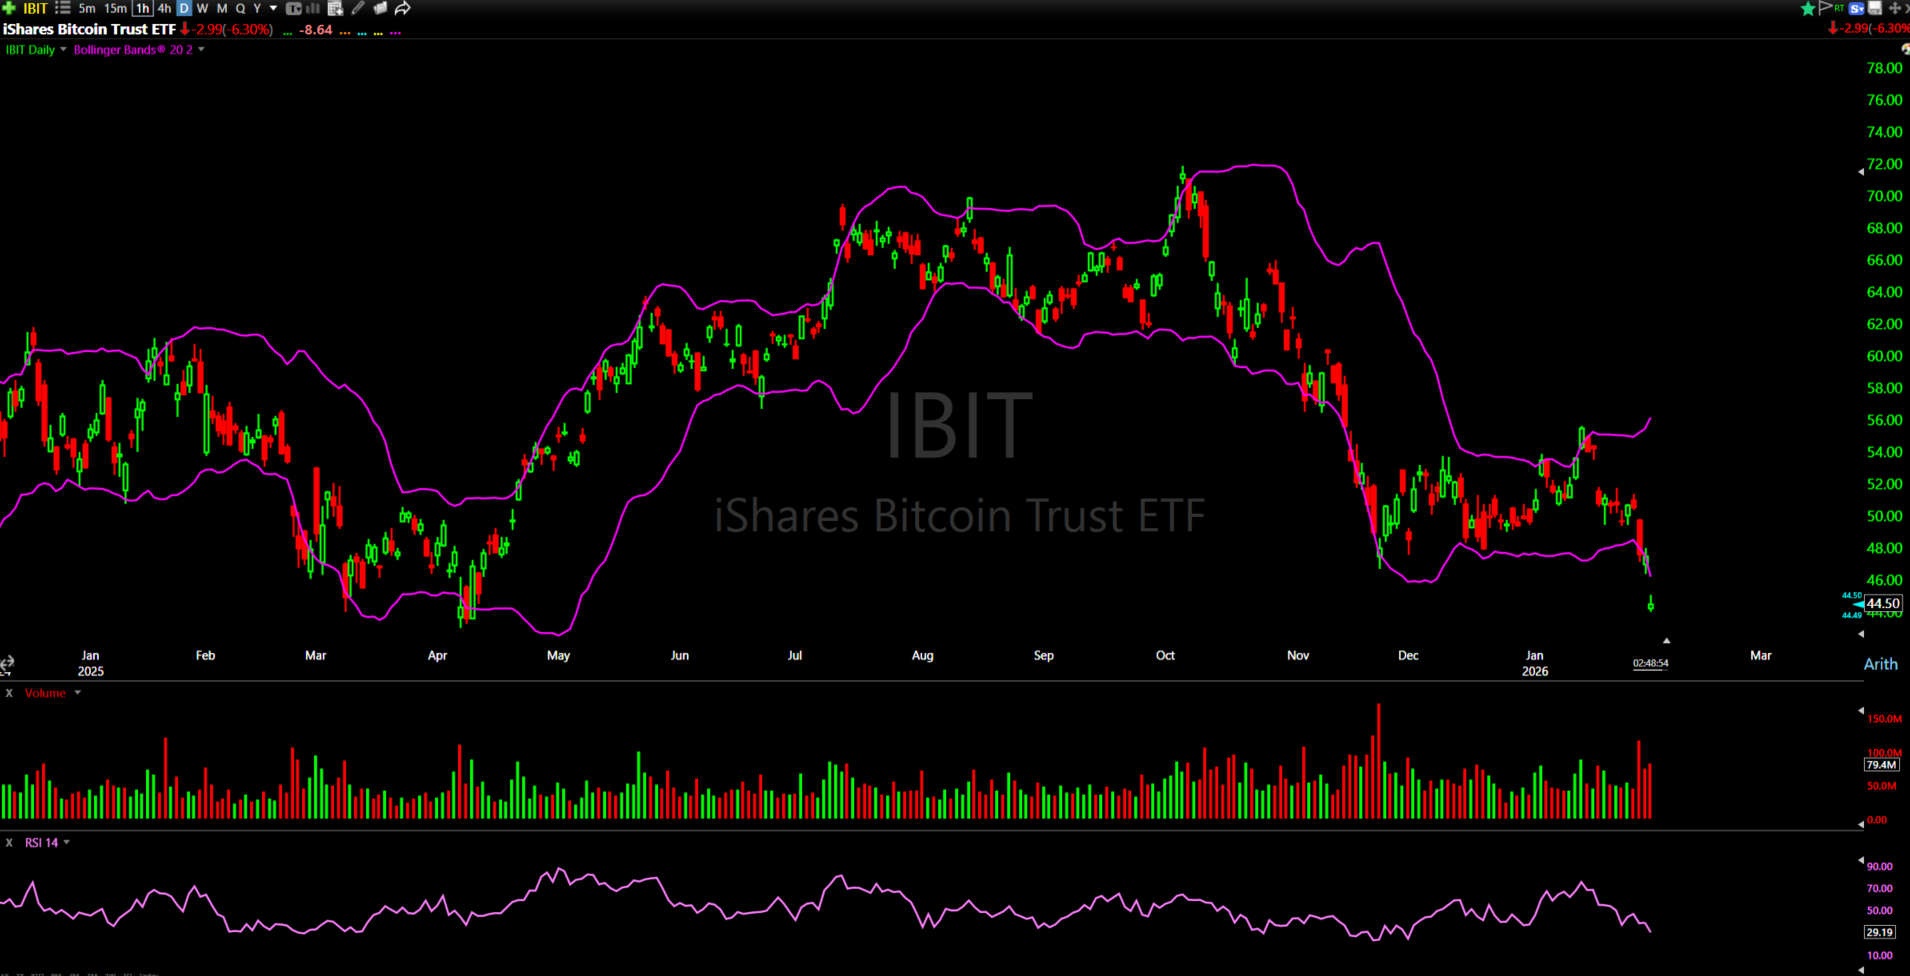
Wells Fargo & Company (NYSE: WFC)
Contracts to Watch: March 6 $93 Calls
Wells Fargo found support at $85 and held.
Now it’s climbing back towards the upper band.
Seeing as it’s above $91.10, I’m seriously considering these March calls.
Viper Energy Inc. (NASDAQ: VNOM)
Contracts to Watch: Feb 20 $42 Calls
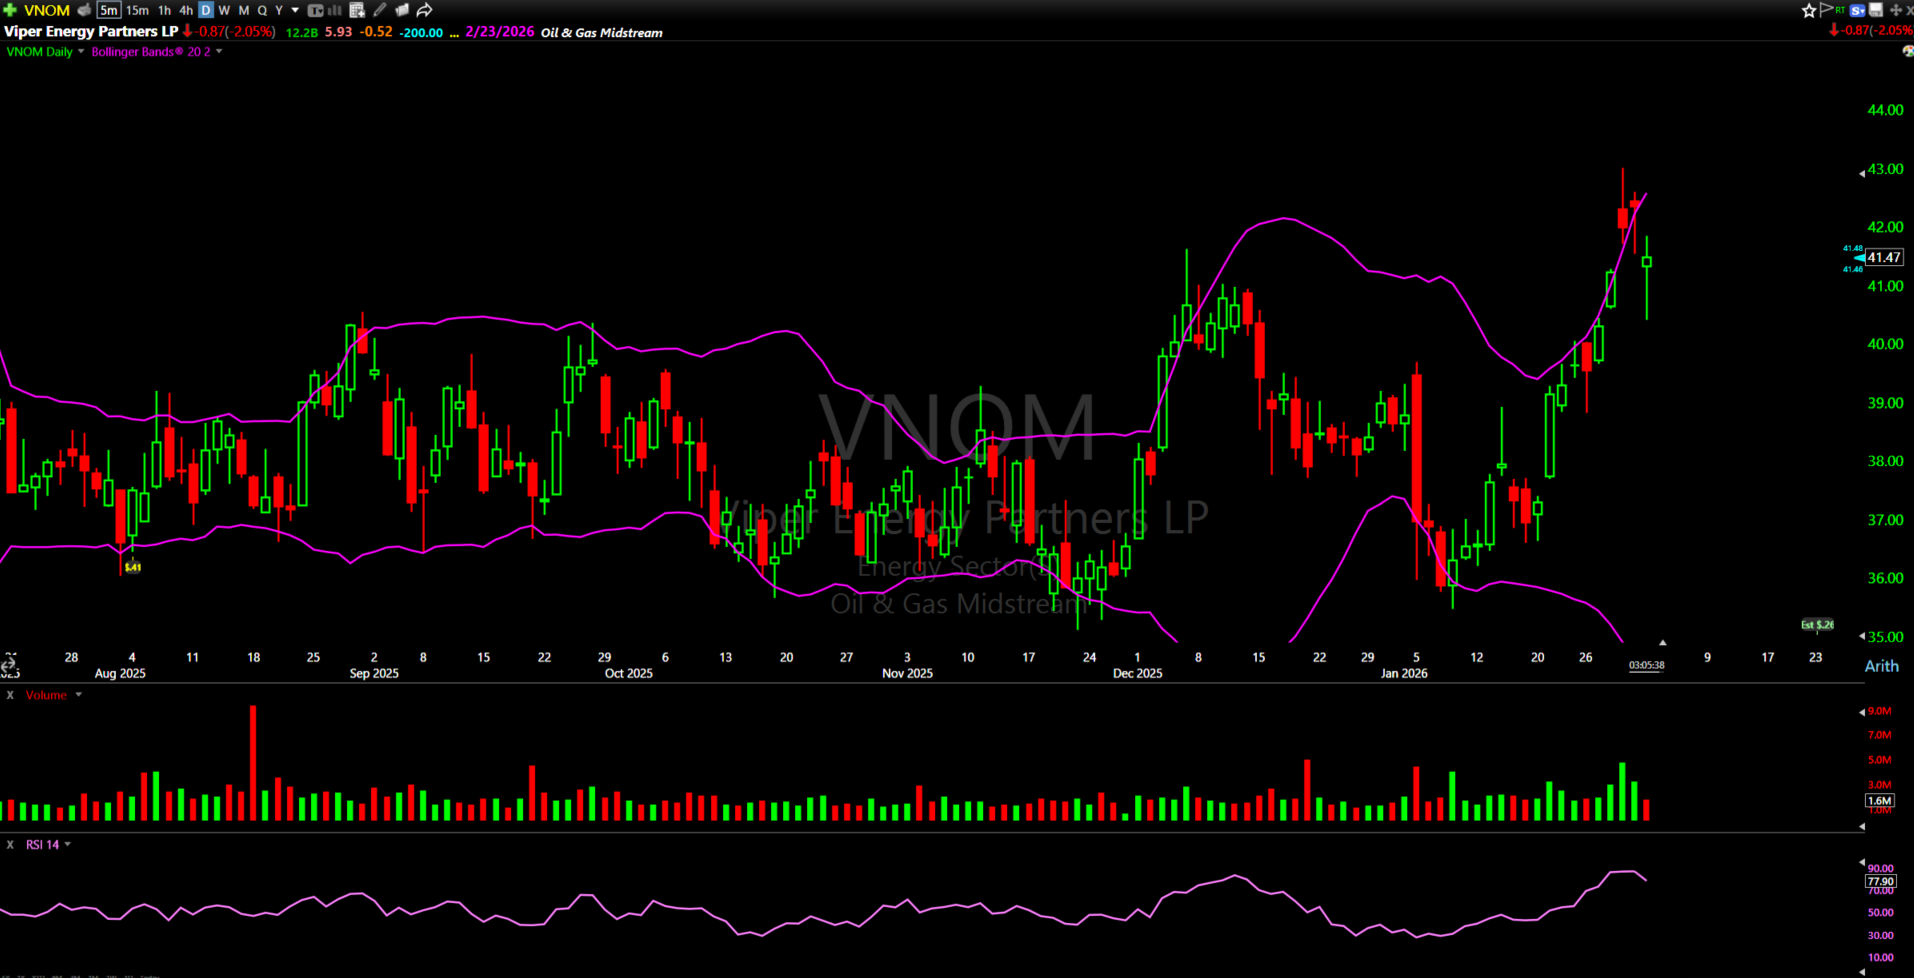
You have no idea what Viper Energy is (and I don’t blame you).
Not a widely-traded name, but the Smart Money is buying.
I’d love to see one of two different things happen here:
First, I’d like to see it get over $43 for a breakout. Create that alert above $43 for the Feb 20 $42 Calls.
Second, if this can get back to $41.68 or below, that would be solid support.
Rigetti Computing Inc. (NASDAQ: RGTI)
Contracts to Watch: Feb 27 $19 Calls
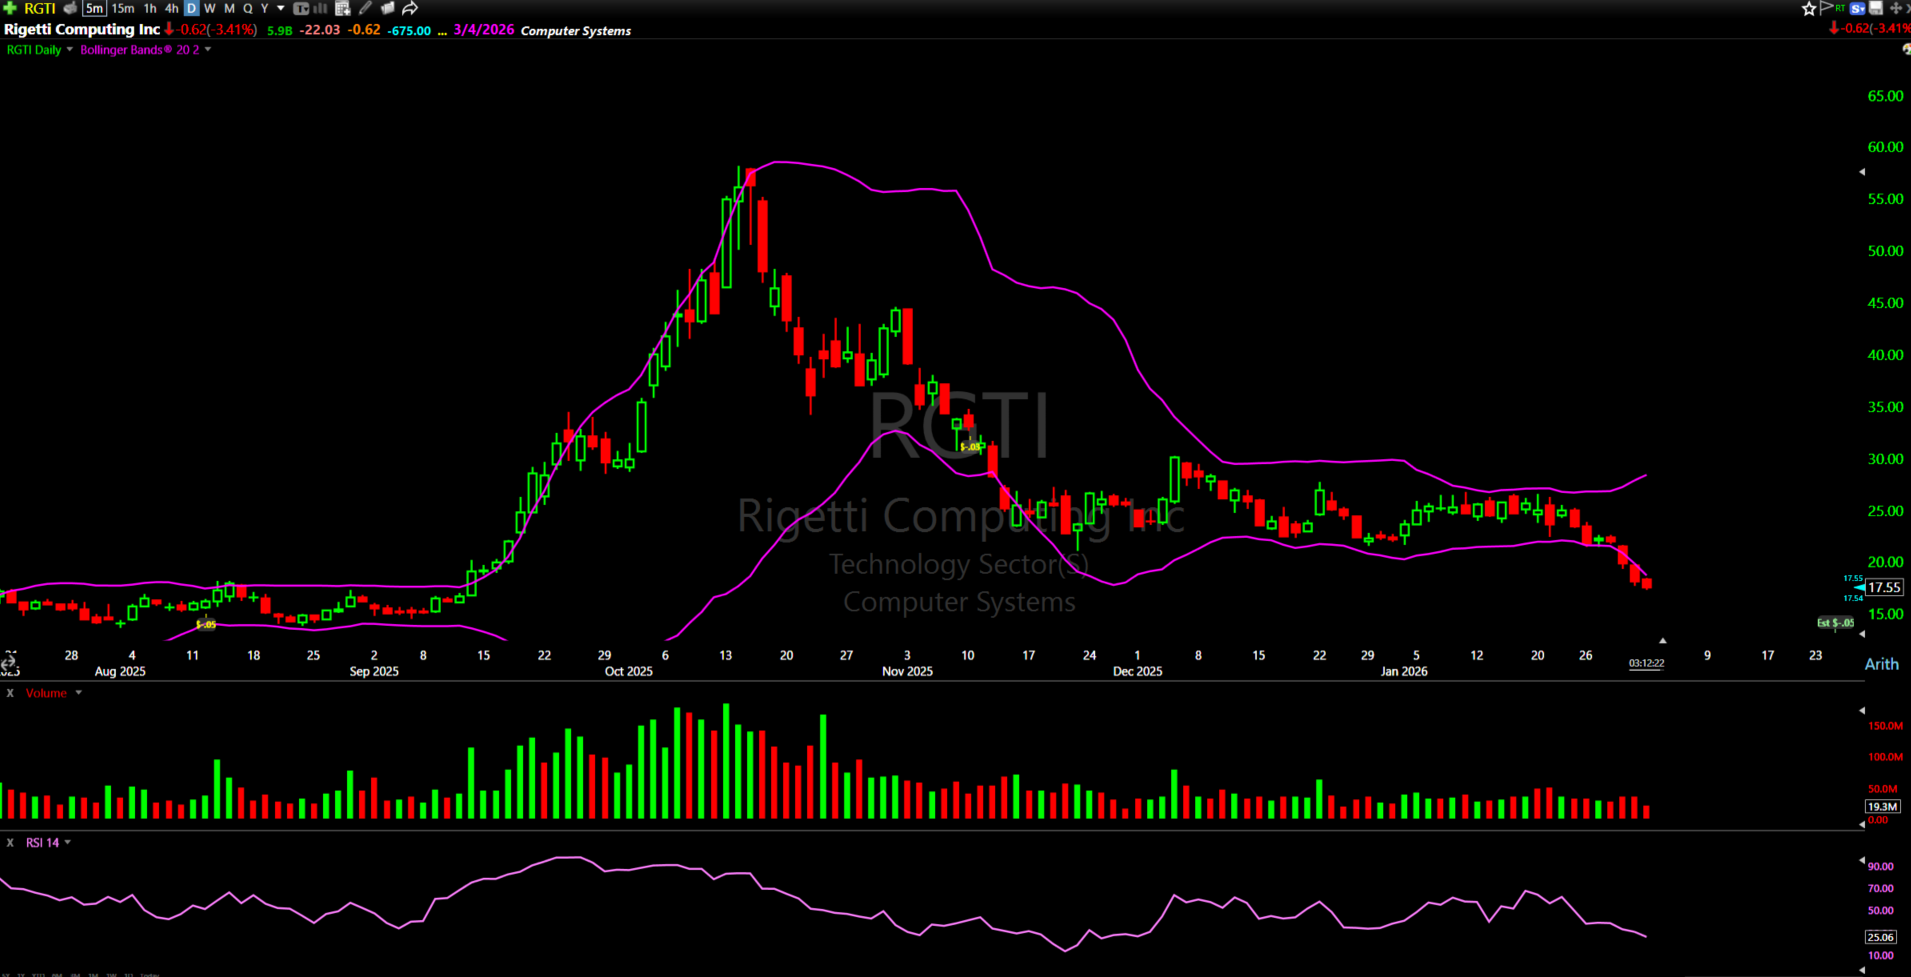
After a huge run and massive crash in quantum computing stocks, RGTI has dropped another 30%+ in the past two weeks.
Now that it’s way below the bottom Bollinger Band, I’m starting to look for a bounce opportunity.
And what do you know, the Smart Money has been hammering these February $19 calls.
iShares Silver Trust (NYSE: SLV)
Contracts to Watch: Feb 6 $80 Calls
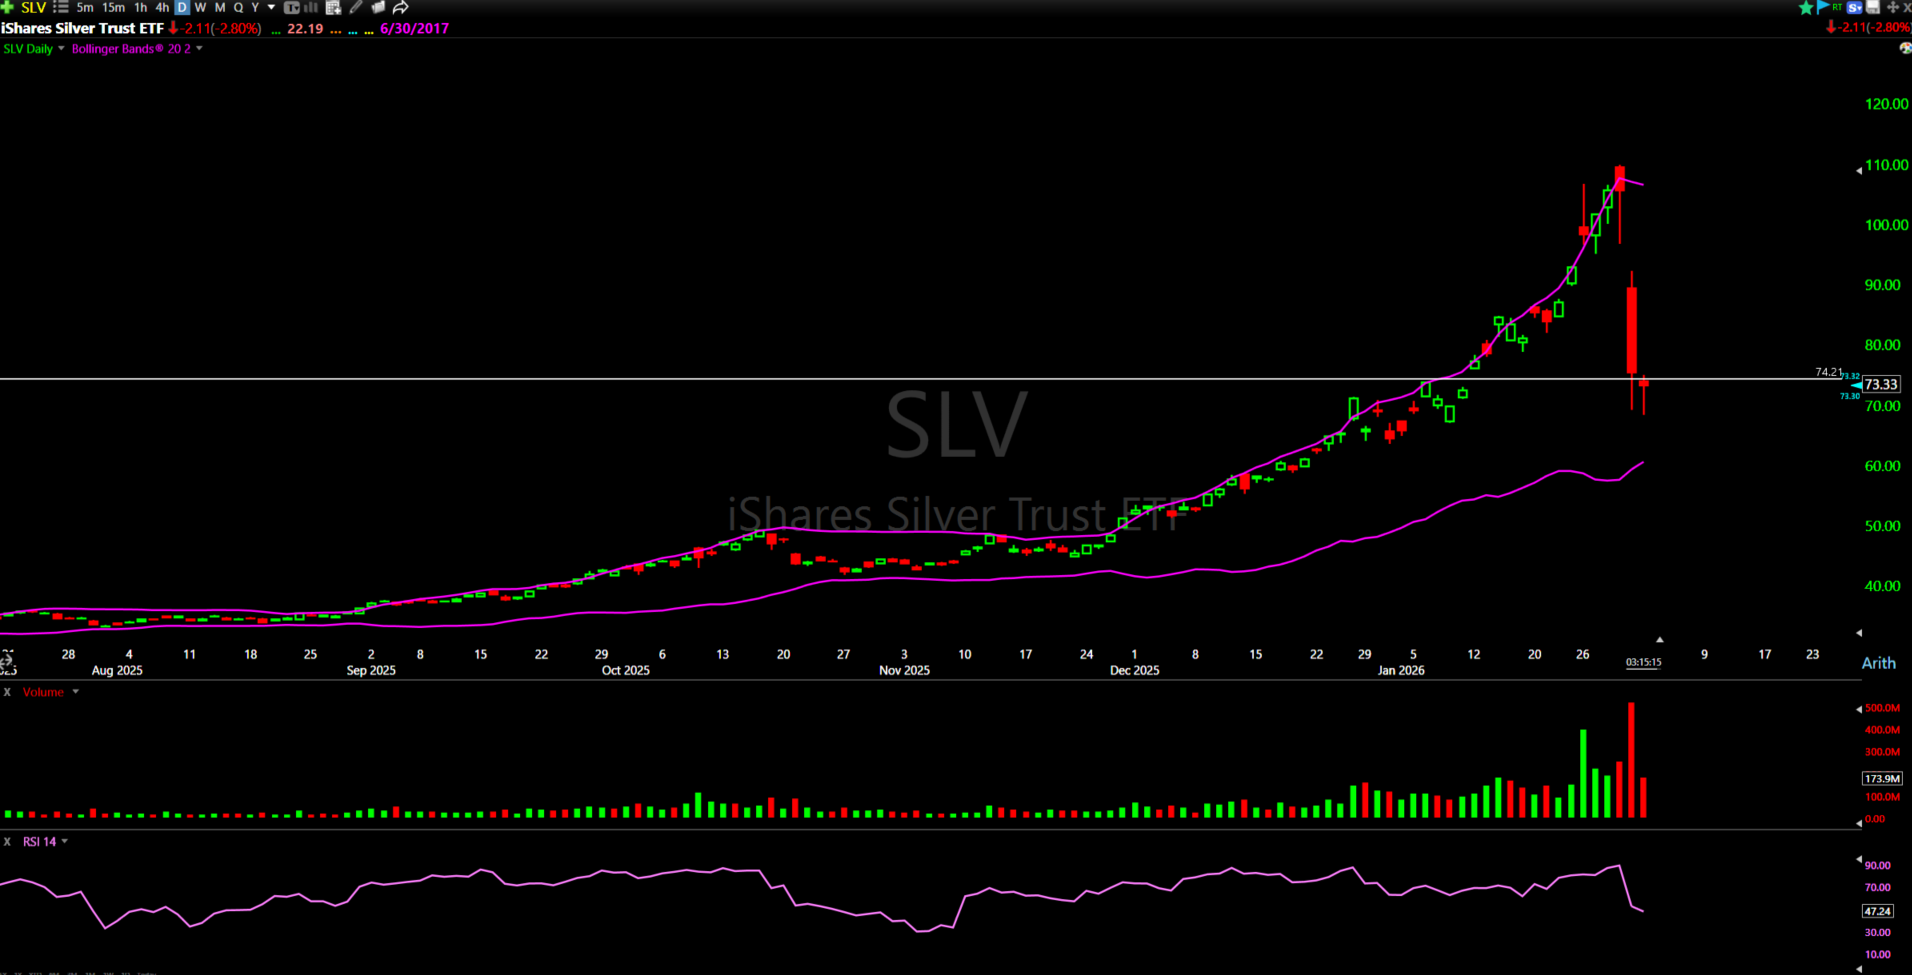
The insane momentum trend is over for SLV, but there may be one more play left in this historic runner (if it can hold $74).
Why $74? Because it’s a key price level (prior resistance from January 6).
And prior resistance can become current support.
If it can hold $74, I’m interested in playing a bounce to $80. I’m eyeing the SLV Feb 6 $80 Calls with a tight stop below $74. Next target after $80: $85.
Wait for your levels. Create those alerts. Let the setups come to you.
Happy trading,
Ben Sturgill
*Past performance does not indicate future results