I kicked off this week’s LIVE mentoring session with The Beatles’ “A Hard Day’s Night.”
Because that’s exactly what this market feels like…
Ever since the election, it’s been the same routine. We drop. We pop. Then we drop again.
And it leads to a BIG trade opportunity…

Those getting chopped up lately, you’re not alone. I’ve heard from plenty of traders who feel like nothing is working. One even told me he’s been doing horrible… consistently.
It’s not bad luck.
There’s one simple reason most trades aren’t working right now.
And it’s sitting on a chart that most traders never bother to check.
The Market’s Weather App
The chart is the Cboe Volatility Index (VIX).
Every trader should pull up this chart before they place a trade. It tells us how much fear is in the market… and whether that fear is building or fading.
Here’s my personal fear scale for the VIX:
- 18.30: I start paying attention.
- 20: There’s fear in the market.
- 24: Extreme fear has entered the market.
- 28: Very extreme.
- 32: That’s a “Dang, Gina, what’s up?”
This year, we’ve only hit “Dang, Gina” once. That was due to the Iran war.
The levels above that are reserved for the big ones. Tariffs. The Japan carry trade. And COVID, the true black swan, which sent the VIX all the way to 80.
But the level isn’t the most important part. The trend is.
Here’s the pattern to notice…
Once the VIX’s daily trend line broke, the market usually turned.
When the tariff trend broke, the SPY ripped. When the Iran war trend broke, almost to the day, the SPY ripped again. And it was the same story in 2025.
Now look at the recent momentum.
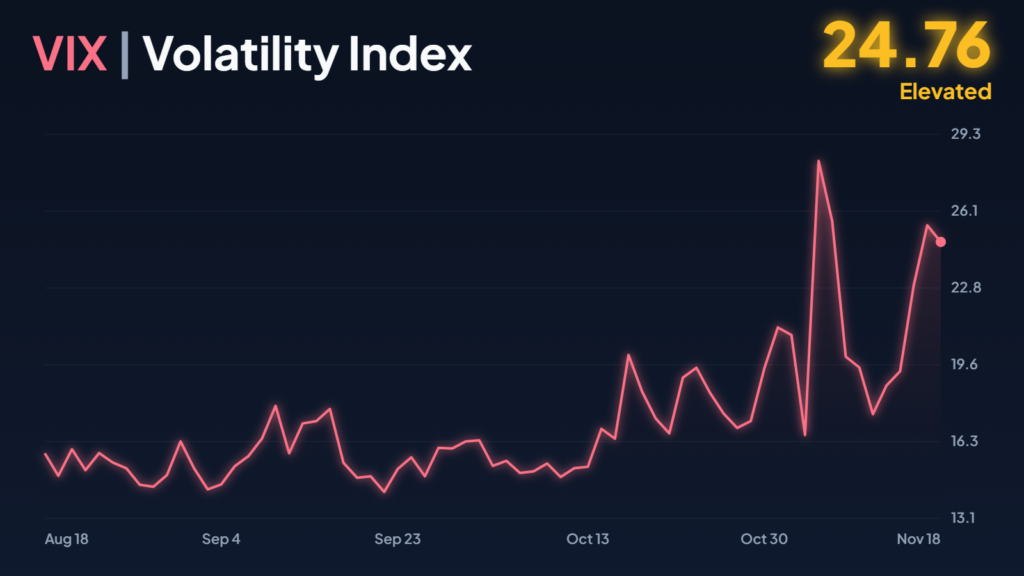
The VIX is still in a daily uptrend. Higher lows, higher highs. It spiked on Election Day, dropped for four days, and bounced right back.
When the market popped post election, plenty of traders thought, “we’re back, baby.” But the VIX trend never broke. So the market rolled over again.
Why does that matter? Because about eight out of 10 stocks move with the indexes. If the indexes are heading lower, most of your trades are swimming upstream.
My Trading Rule
While the VIX is in a daily uptrend, I expect the market to keep going lower… until that trend line breaks.
Think of it like checking the weather app. I used to live in New Hampshire. By May, after a long winter, we’re dying to get outside. But if the app says it won’t top 50 degrees, we’re not going water skiing that day. Set your expectations before you walk out the door.
The VIX is your market weather app. Check it every morning, and you won’t get confused, frustrated, or perplexed when your bullish setups fizzle out. You’ll already know why.
My Trade Plan
So what do you do when the weather’s bad?
You’ve got three choices:
- Ignore it. Fight the tide, and you’ll likely pay for it.
- Sit it out. That’s okay. In Reminiscences of a Stock Operator, Jesse Livermore went months without trading when it wasn’t his market. Decide what brings you back, like a break in the VIX trend.
- Look for the opportunities that do exist.
I’m going with door number 3.
For me, that means trading the indexes in the direction they’re trending… or finding relative outperformers in strong sectors that the market has pulled back to low-risk buy levels.
Over the past month, a handful of sectors have held up:
- Consumer discretionary (XLY)
- Consumer staples (XLP)
- Real estate (XLRE)
- Utilities (XLU)
- Health care (XLV)
- And financials (XLF)
So I filtered my scanner for bullish stocks in bullish sectors, with aggressive buying at the ask. One name jumped off the screen this week…
SELLAS Life Sciences Group Inc. (NASDAQ: SLS)
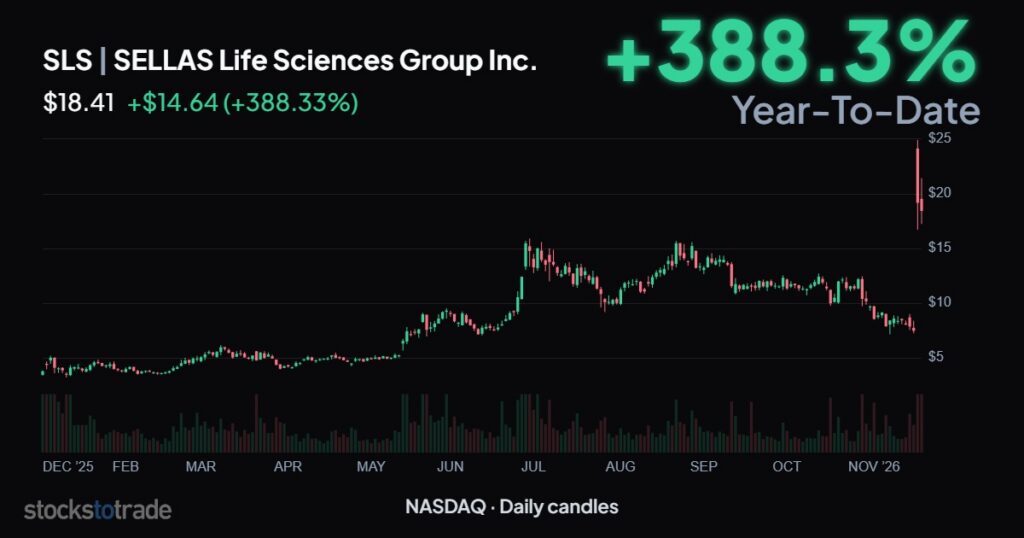
There’s “smart money” behind it…
Someone bought 6,204 of the April 16, 2027 $40 calls. At the ask. With zero open interest (this order opened brand-new positions).
Here’s how it checks my boxes:
- Strong sector: It’s a cancer-drug developer, so it falls square in health care.
- Strong trend: The chart has been on a tear.
- Smart money: Someone placed a big, aggressive bet.
One concern… that strike sits well outside the options market’s expected move.
Something’s up here. But I don’t know what. That’s exactly why I’m keeping my position small.
Here’s my plan:
- Tracer round: I bought one April $40 call at $2.00 to track the trade.
- Add: At or below $16 per share, near previous resistance that should act as support.
- Cut the trade: Down 25% on the option.
- Take profits: Scale out at 20%, 40%, and 100%, or at previous resistance levels.
Why not buy calls closer to the money? They’re expensive. And someone chose to put serious money into this strike.
I’m treating this one like a lotto ticket. Size it accordingly.
Now, here’s the game plan for the rest of us going forward.
Every morning, check the VIX daily chart. If it’s still trending higher, expect more downside and trade accordingly.
Then spend your time building your watchlist. Answer four questions:
- What do I like?
- Why do I like it?
- Where would I want to buy it?
- What’s my plan?
There are still trading opportunities during a fearful market. We just have to know where to look.
Be good (and be good to others),
Ben Sturgill
*Past performance does not indicate future results. Not typical.