Good morning, traders…
The market opens in 30 minutes.
You’ve got your coffee. Your charts are loaded. Your scanner is running.
What now?
You’re staring at 200 tickers flashing green and red, trying to figure out which ones are worth trading today.
The average trader picks their trades based on random parameters.
They see something moving and jump in. No plan. No confirmation. Just hope that momentum continues.
Then they wonder why they’re always chasing moves that already happened.
The best day trades reveal themselves in the first 30 minutes … if you know what to look for.
You don’t need to scan every stock. You don’t need to chase breakouts. You just need a repeatable process that tells you where Smart Money is already positioned.
This morning, I identified two setups using this exact process.
It’s not even lunchtime. But I’ve already banked 42% on one and 39% on the other.*
And both trades are still running.
These weren’t lucky picks. They were the result of a system I use every single morning to filter 200 tickers down to the 2 or 3 worth trading.
If you’re tired of missing huge moves or entering trades too late, this process will change how you start your trading day.
Let Me Show You How To Find The Best Day Trading Setups In The First 30 Minutes…
How I Find Winning Day Trades
I take the same four steps every morning because the process is simple, repeatable, and effective.
Step 1: Organize Scanner By Trade Size
I pull up my Options Income Trader scanner and sort by trade size.
Biggest $ trades on top.
Size matters. When someone drops $500,000 on a single options contract, they’re not guessing. They’re not testing the waters. They’re making a statement.
Big money moves first, retail follows later. I want to see where the Smart Money is flowing before everyone else shows up.
Step 2: Review Charts
Starting from the top of the scanner list, I pull up the charts.
I’m not looking at every stock. I’m looking at the ones where Smart Money just showed up. And I’m asking one question: is there a technical setup here that makes sense?
If the chart looks clean, I dig deeper. If it doesn’t, I move on. No exceptions.
Step 3: Look For Entries Near Key Price Levels
The best day trades don’t happen at resistance. They happen at support.
I want to see price testing VWAP or sitting on a previous support level. That’s where buyers step in. That’s where risk is defined. That’s where the setup forms.
If the price is already extended or stuck in range-bound consolidation, I pass.
Step 4: Confirm With Confluence
One indicator is a clue.
Two indicators are intriguing.
A confluence of indicators? That’s a setup.
I’m looking for multiple bullish indicators to coincide on the chart.
VWAP + previous support/resistance + moving averages all lining up in the same area.
When multiple signals align, I have the conviction to enter without hesitation.
That’s the process.
Now let me show you how it played out yesterday…
Trade #1: United Airlines Holdings Inc. (NYSE: UAL)
My first move was trading calls on United Airlines Holdings Inc. (NYSE: UAL).
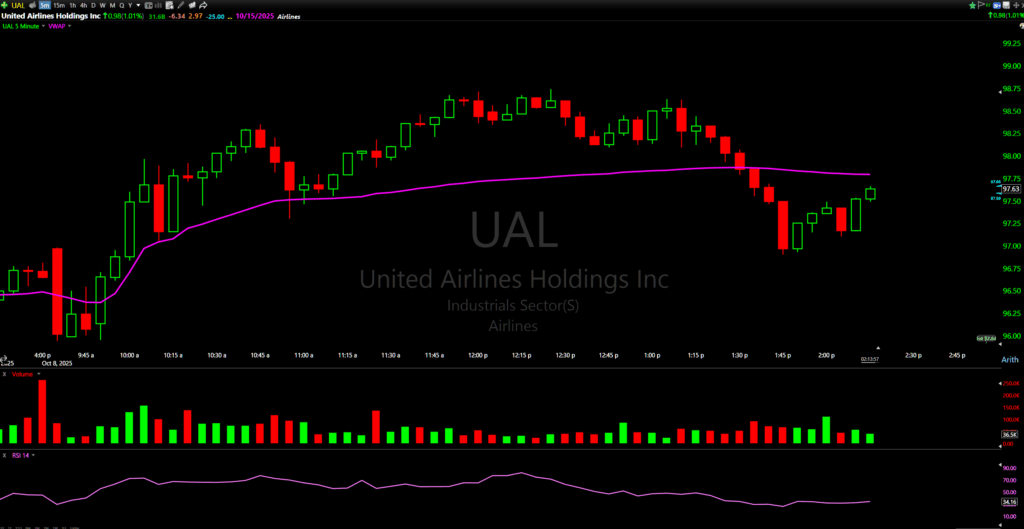
The scanner flagged heavy volume on October 10 $103 Calls.
I pulled up the chart. The price was sitting right on VWAP around $97.55.
That also happened to be a previous support/resistance level.
Coincidence? No.
Confluence? Yes.
Multiple signals were indicating the same direction.
I bought the October 10 $103 Calls at $1.05.
First Target: $1.26
Stop Loss: Below $0.85 (around 20% risk)
I’ve already exited my second scale at $1.50 for 42% gains.
My next target is $2.00. Stop loss moved up to $1.20.
Why did this work? Because price respected VWAP.
When a stock holds support at a key level, buyers are stepping in.
Trade Idea #2: Figma Inc. (NASDAQ: FIG)
My next trade was on Figma Inc. (NASDAQ: FIG).
This name was getting massive scanner volume on the October 17 $70 Calls.
FIG is a relatively new stock breaking out of a multi-month range.
When the intraday chart pulled back to VWAP at $67.35, I saw confluence forming again.
VWAP. Previous support. Breakout structure. All aligning…
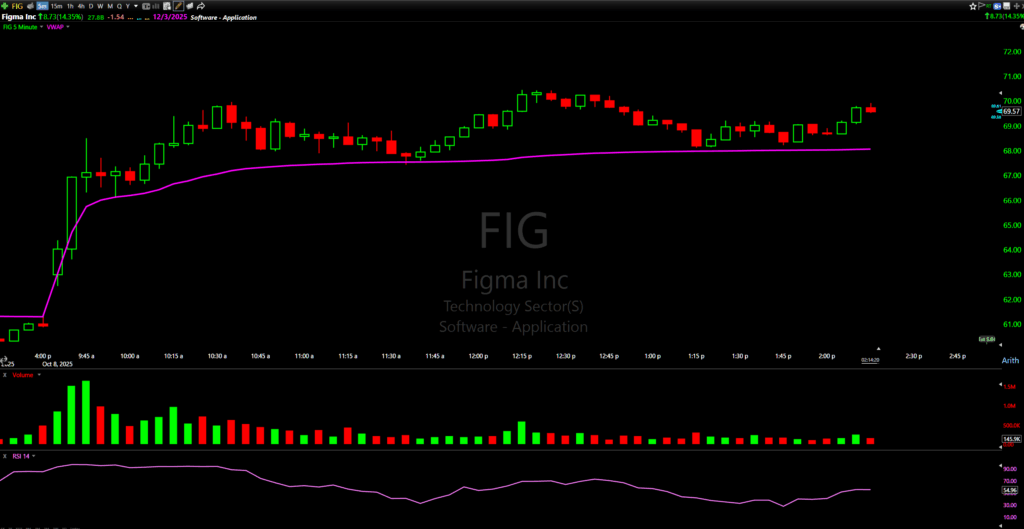
I bought the October 17 $70 Calls at $3.30.
First Target: $4.00
Stop Loss: $2.95
I’ve already exited my second scale at $4.60 for a 39% gain.
My next target is $5.50. Stop loss moved up to $4.00.
Same process and similar confluence to UAL.
Why This Process Works
The reason this process works is simple…
- You’re following Smart Money.
- You’re waiting for technical confirmation.
- You’re entering near support with defined risk.
- Most importantly, you’re identifying a confluence of signals to build conviction before you risk a dime.
Train your eyes to spot these setups.
Look for multiple indicators aligning in the same area. Stick to the process: scan, chart, confirm, execute.
Treat your trades like employees.
Reward the ones who respect your rules. Cut the ones that don’t.
That’s how you turn simple morning scans into winning day trades.*
And speaking of winning day trades…
The G.O.A.T., Tim Sykes, is $24,000 away from $8 million in trading profits…*

And he wants YOU there when it happens.
He’s literally inviting you to watch his final push to $8 million.
LIVE. On camera. With real money.
Free tickets are limited. Register here before they’re gone.
Happy trading,
Ben Sturgill
*Past performance does not indicate future results