Today, I’ll show you a handful of the most promising setups I’m seeing this week…
Including one of the best of the year.
But first, let’s zoom out.
The VIX closed around 24 yesterday, down from a whopping 30 last week. Better, but still elevated. State Street SPDR S&P 500 ETF Trust (NYSEARCA: SPY) bounced off its lows. Holding above support. The market looks much better than it did ten days ago.
So, is it time to buy calls?
Only if they’re on the right stocks…
This is the first full week of April. There are major events on the economic calendar every day for the next three days. The Iran war is still on. With a VIX this high, and this much uncertainty … forcing trades is a recipe for disaster.
Specific trades = terrific trades.
I’m setting my sights on these 6 charts…
First: What’s On The Calendar?
This week is loaded with potentially market-moving data.
Today: Durable goods orders.
Wednesday: FOMC minutes. The market will parse every word looking for clues about the timing of rate cuts.
Thursday: GDP and Core PCE. Core PCE is the Fed’s preferred inflation gauge. If it comes in hotter than expected, rate cut expectations get pushed back further.
Any one of these could trigger a 2-3% move in the indexes (why I’m staying selective).
I said selective, not sidelined…
Times like this can make those rare gems (truly great setups) even greater because they stand out amid a sea of sideways chop, attracting setup-starved bulls far and wide…
My Top 6 Setups Of The Week
These all have unusual Smart Money options flow, clean technical levels, and solid risk/reward (even with a high VIX).
QCOM April 10 $130 Calls
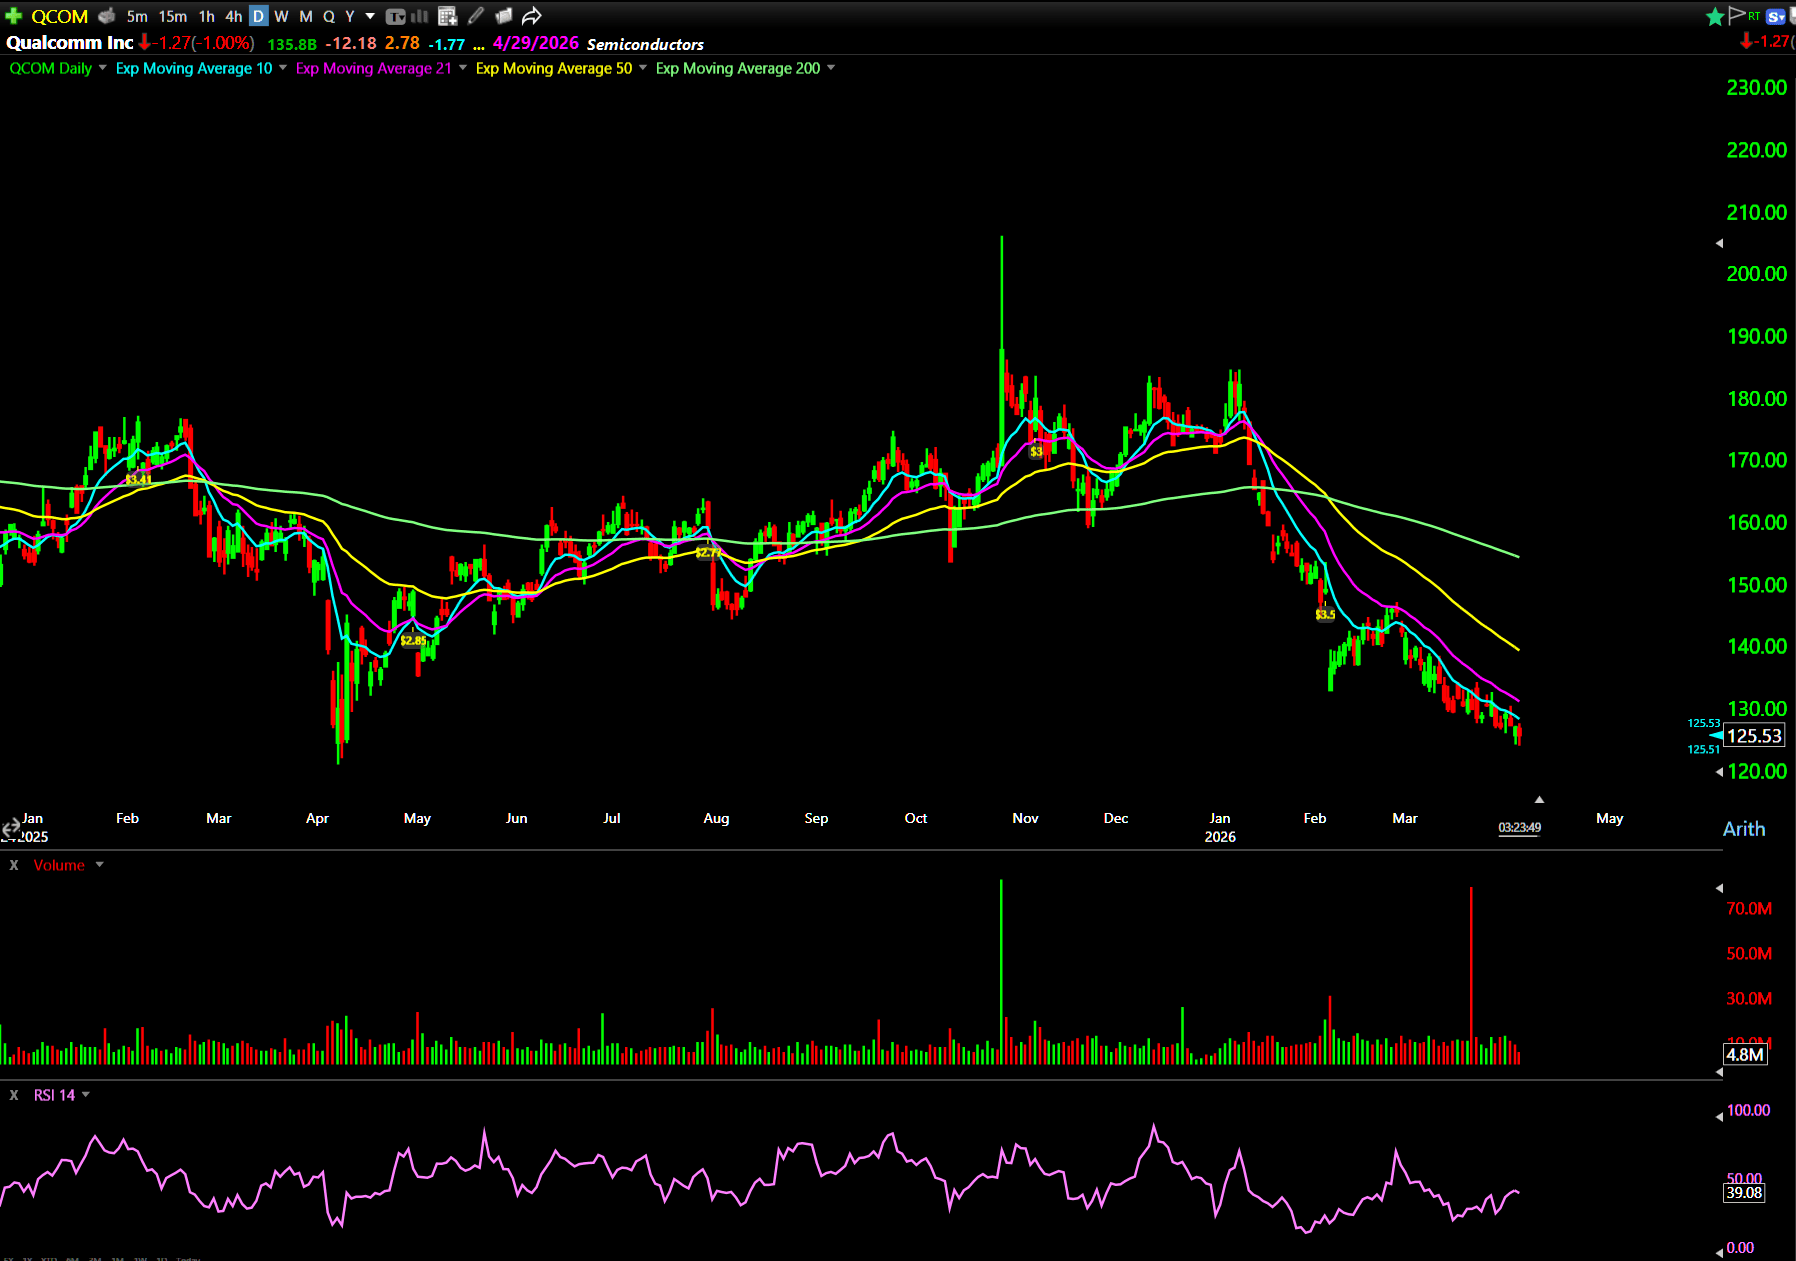
I’m watching Qualcomm Incorporated (NASDAQ: QCOM) for either a pullback into the $126 area or a breakout above $128. Those are the triggers. Options flow last week was heavily bullish. Smart money appears positioned for upside in QCOM.
CRCL April 10 $93 Calls
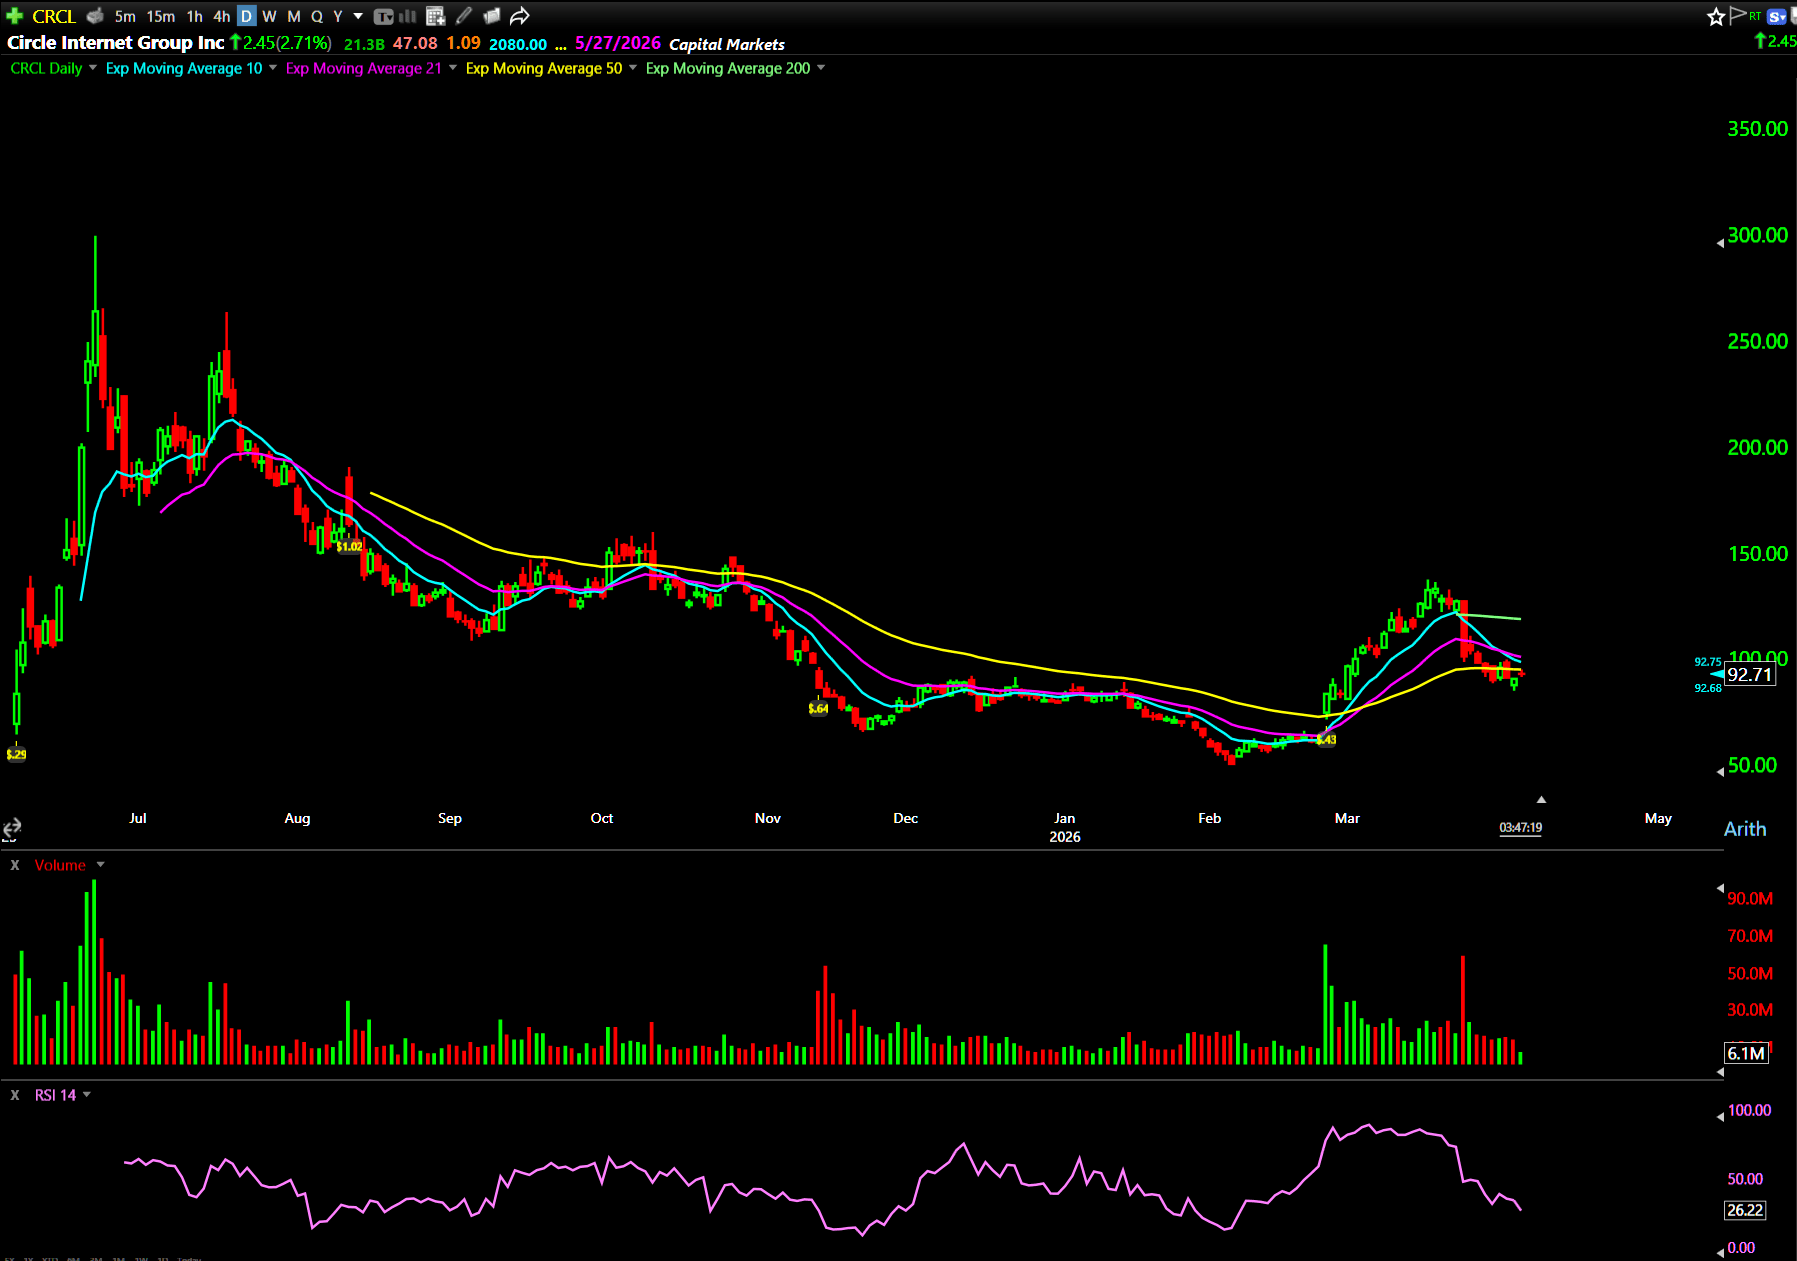
Circle Internet Group Inc. (NYSE: CRCL) is showing bullish structure above the 200 SMA. A pullback toward $90.75 could be actionable if we get it. Or a breakout above $95 confirms continuation. Either level works depending on how CRCL sets up.
IREN April 24 $42 Calls
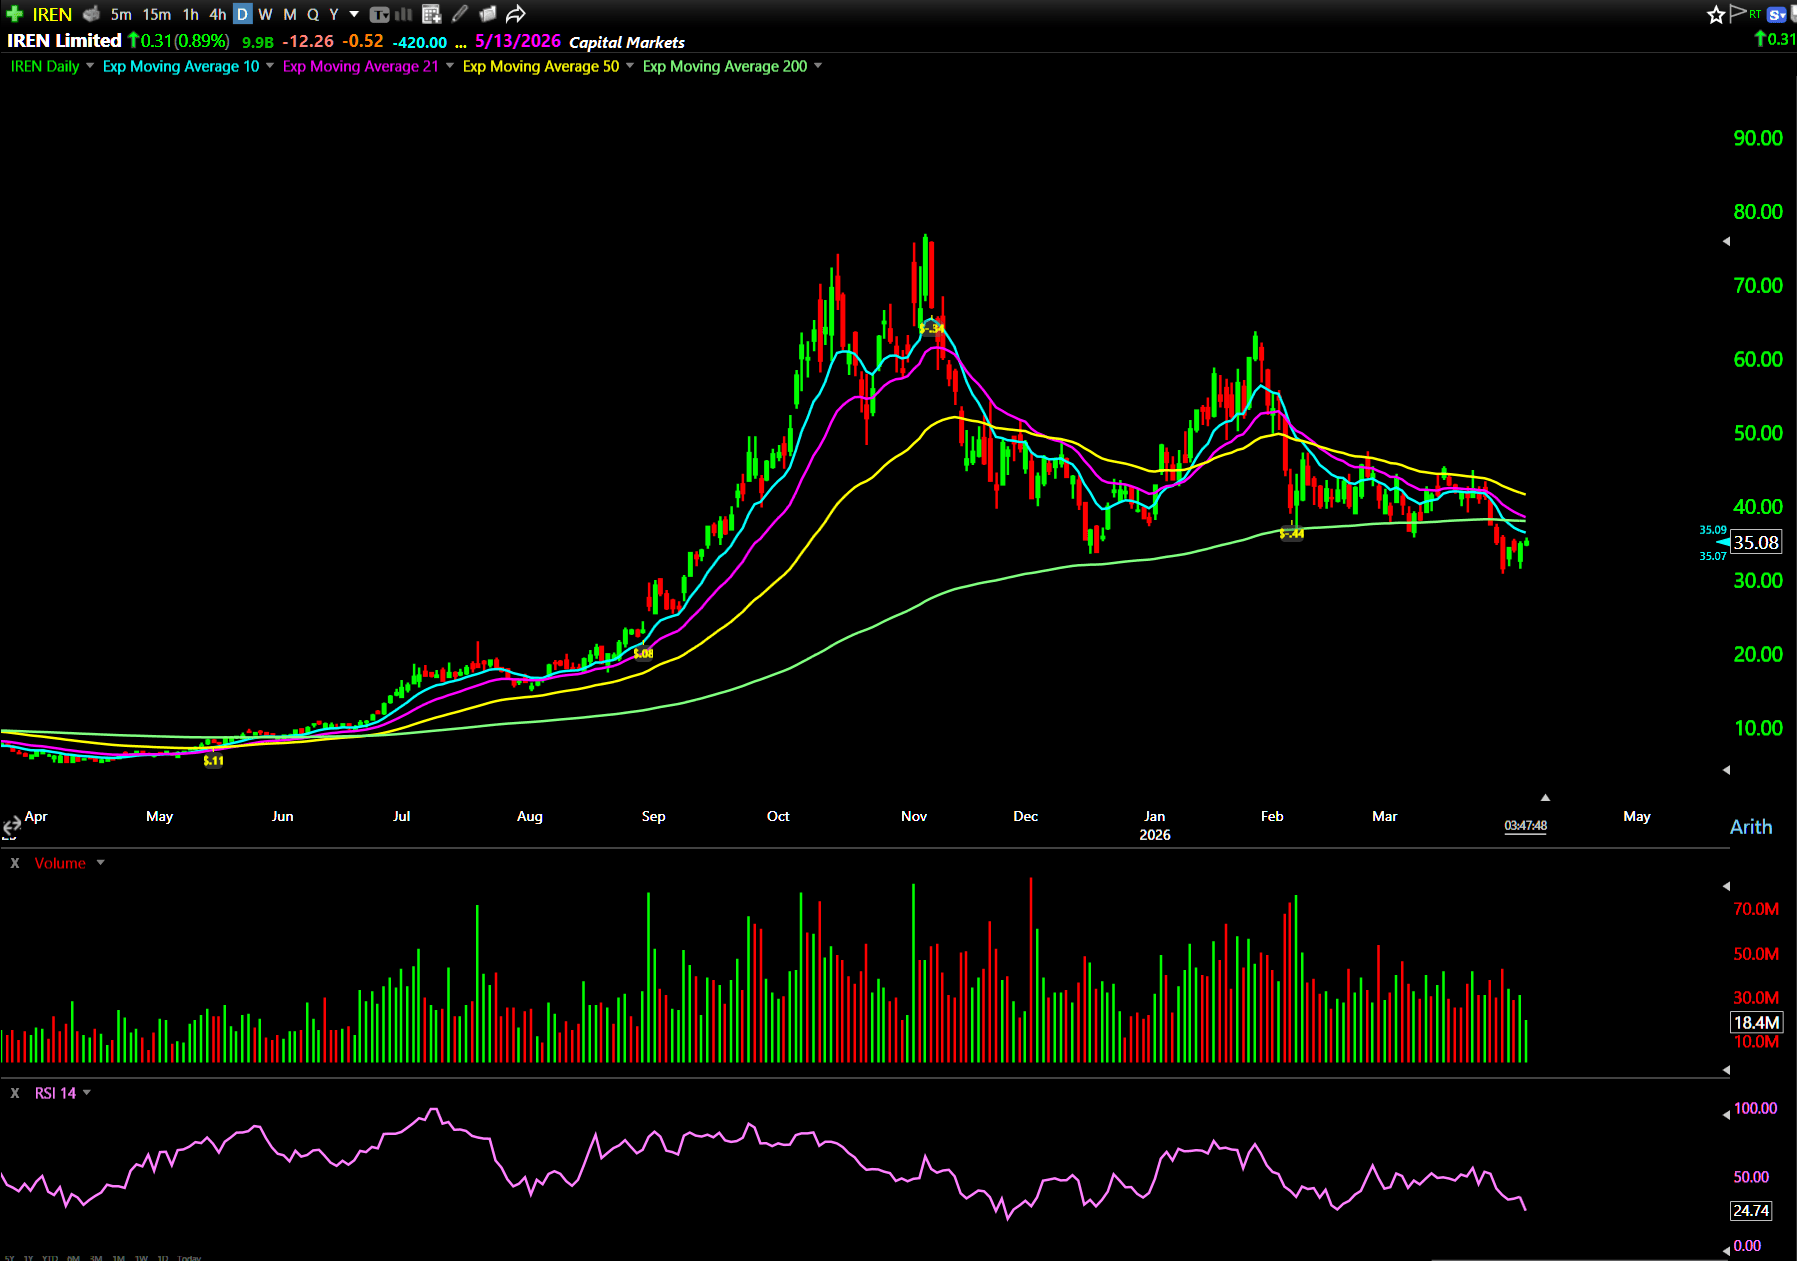
IREN Ltd. (NASDAQ: IREN) has a clean double-bottom setup forming on the daily chart. A move above $36.20 is where it gets interesting. Secondary entry opportunity on a pullback toward $34.75 if the first breakout fails and IREN retests support.
BMNR May 15 $24 Calls
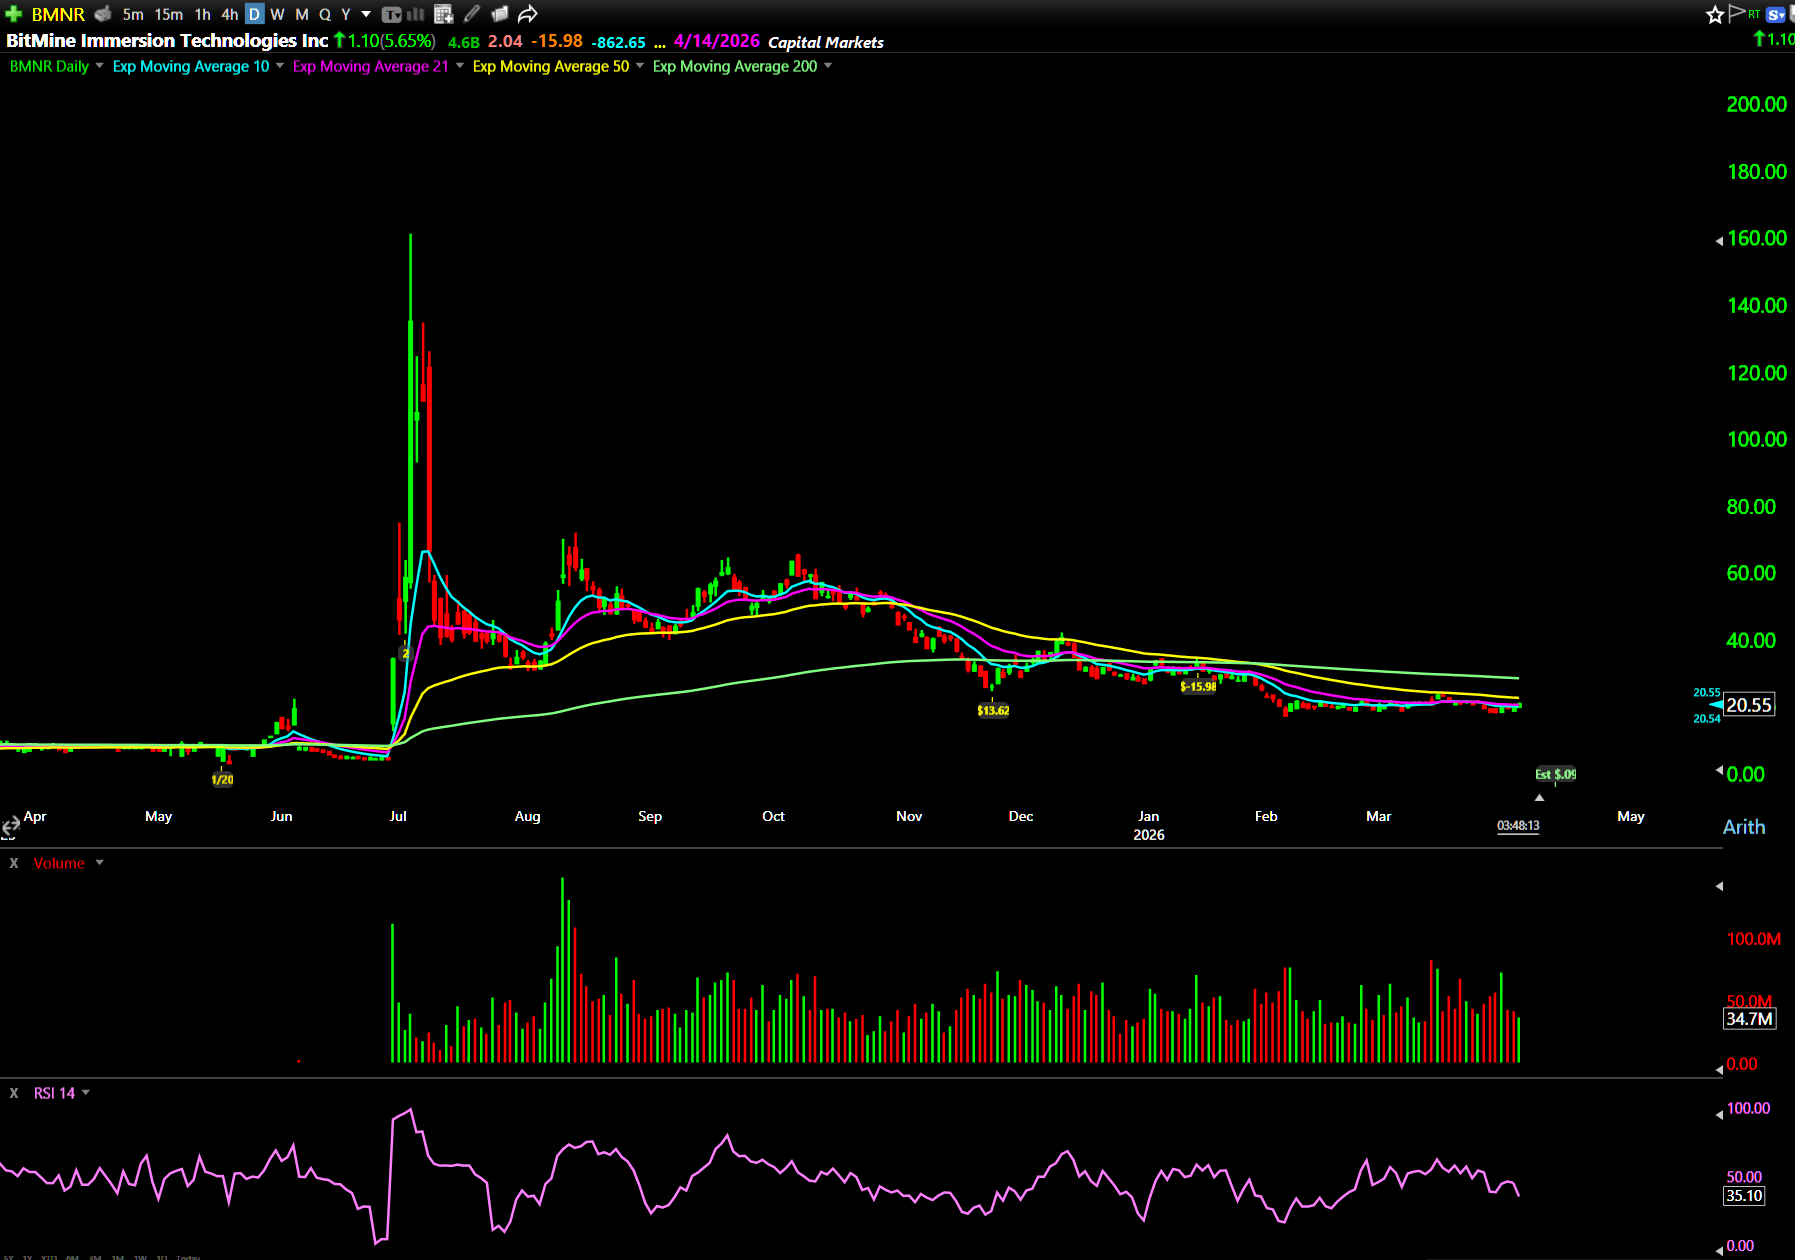
Bitmine Immersion Technologies Inc. (NYSEAMERICAN: BMNR) is holding well with a hammer candle on the daily. That’s a reversal signal after selling pressure. A break above $20.40 is the key trigger level. Fallback entry near $18.96 if BMNR pulls back to support first before breaking out.
BTDR May 15 $12.50 Calls
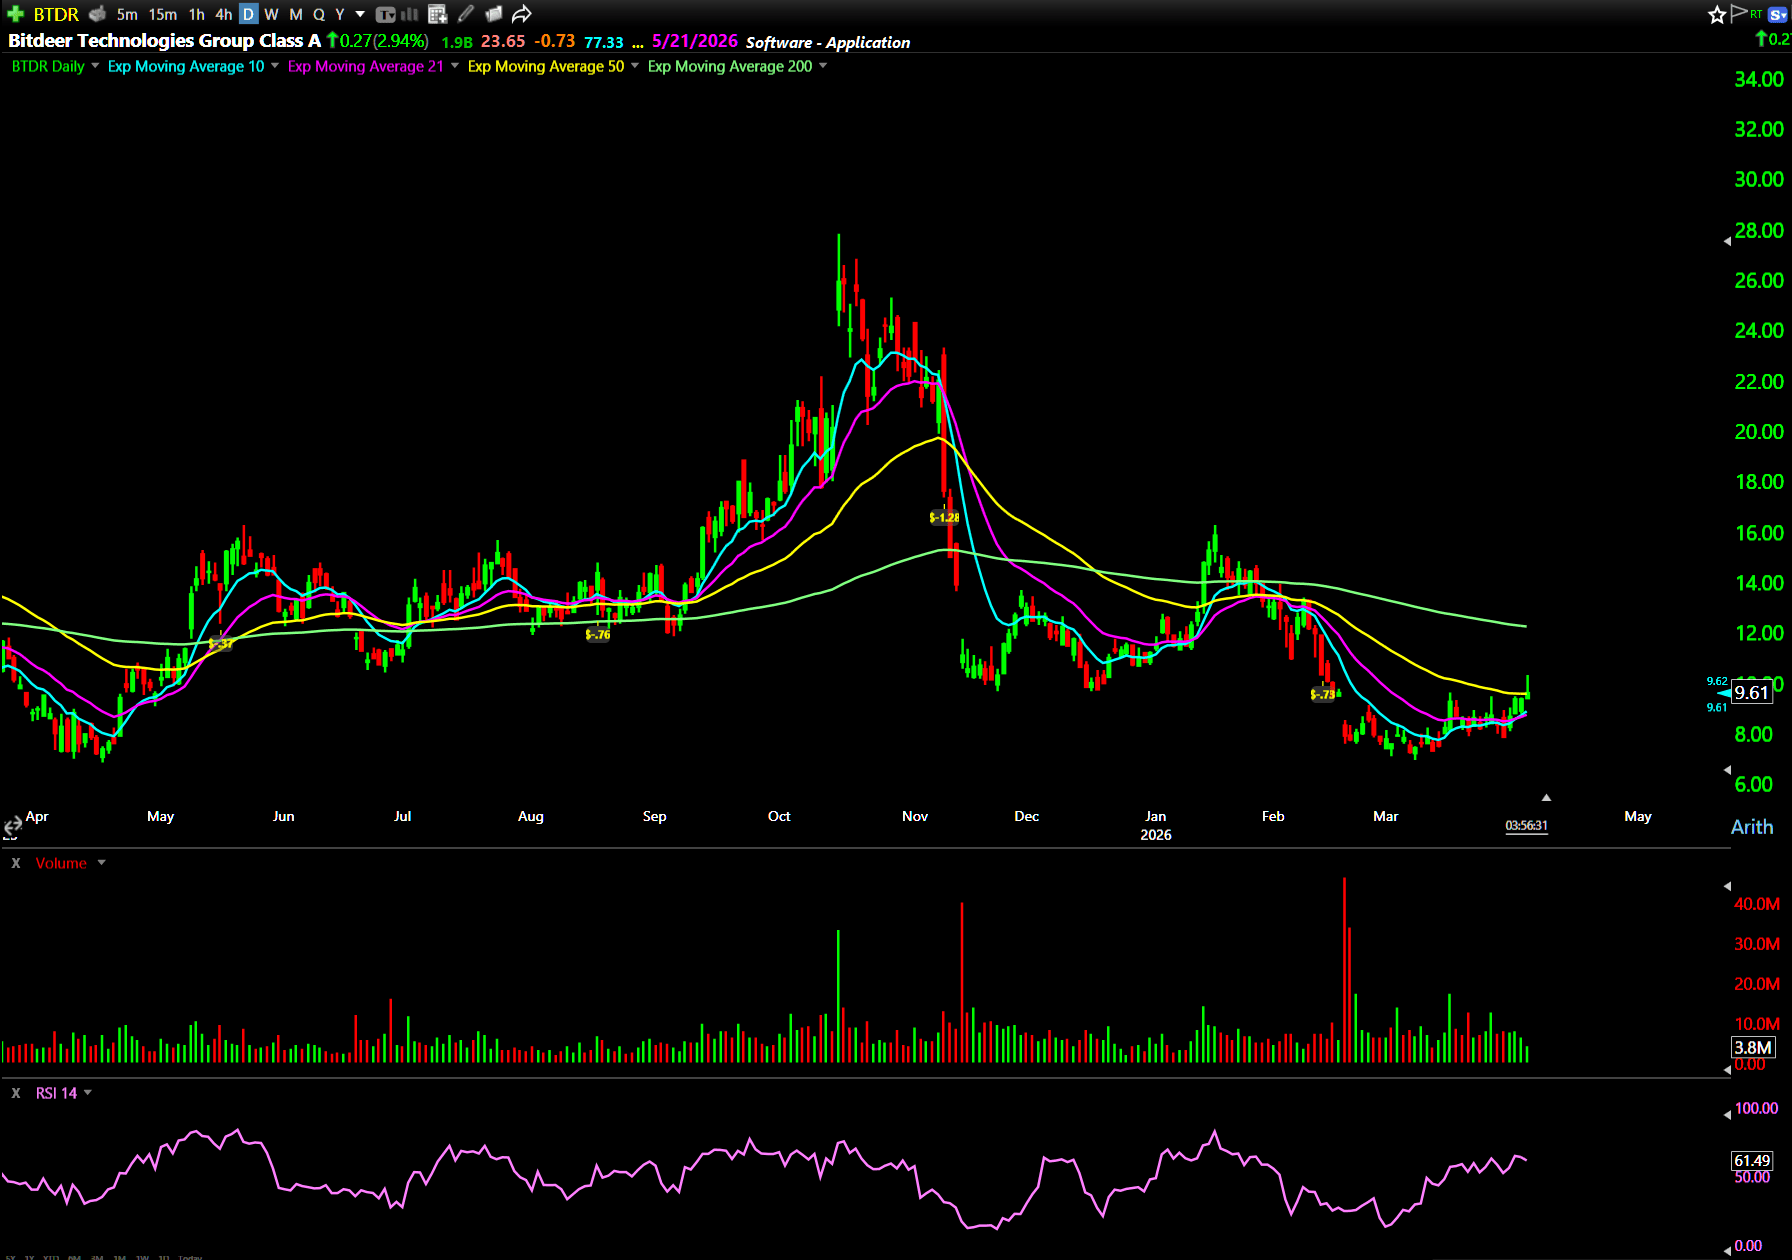
Bitdeer Technologies Group (NASDAQ: BTDR) showed massive options activity last Friday. If it breaks above $9.60, that’s where BTDR becomes actionable. A pullback toward $9.00 is also worth watching as a secondary entry if it consolidates before the next leg up.
META April 10 $585 Calls
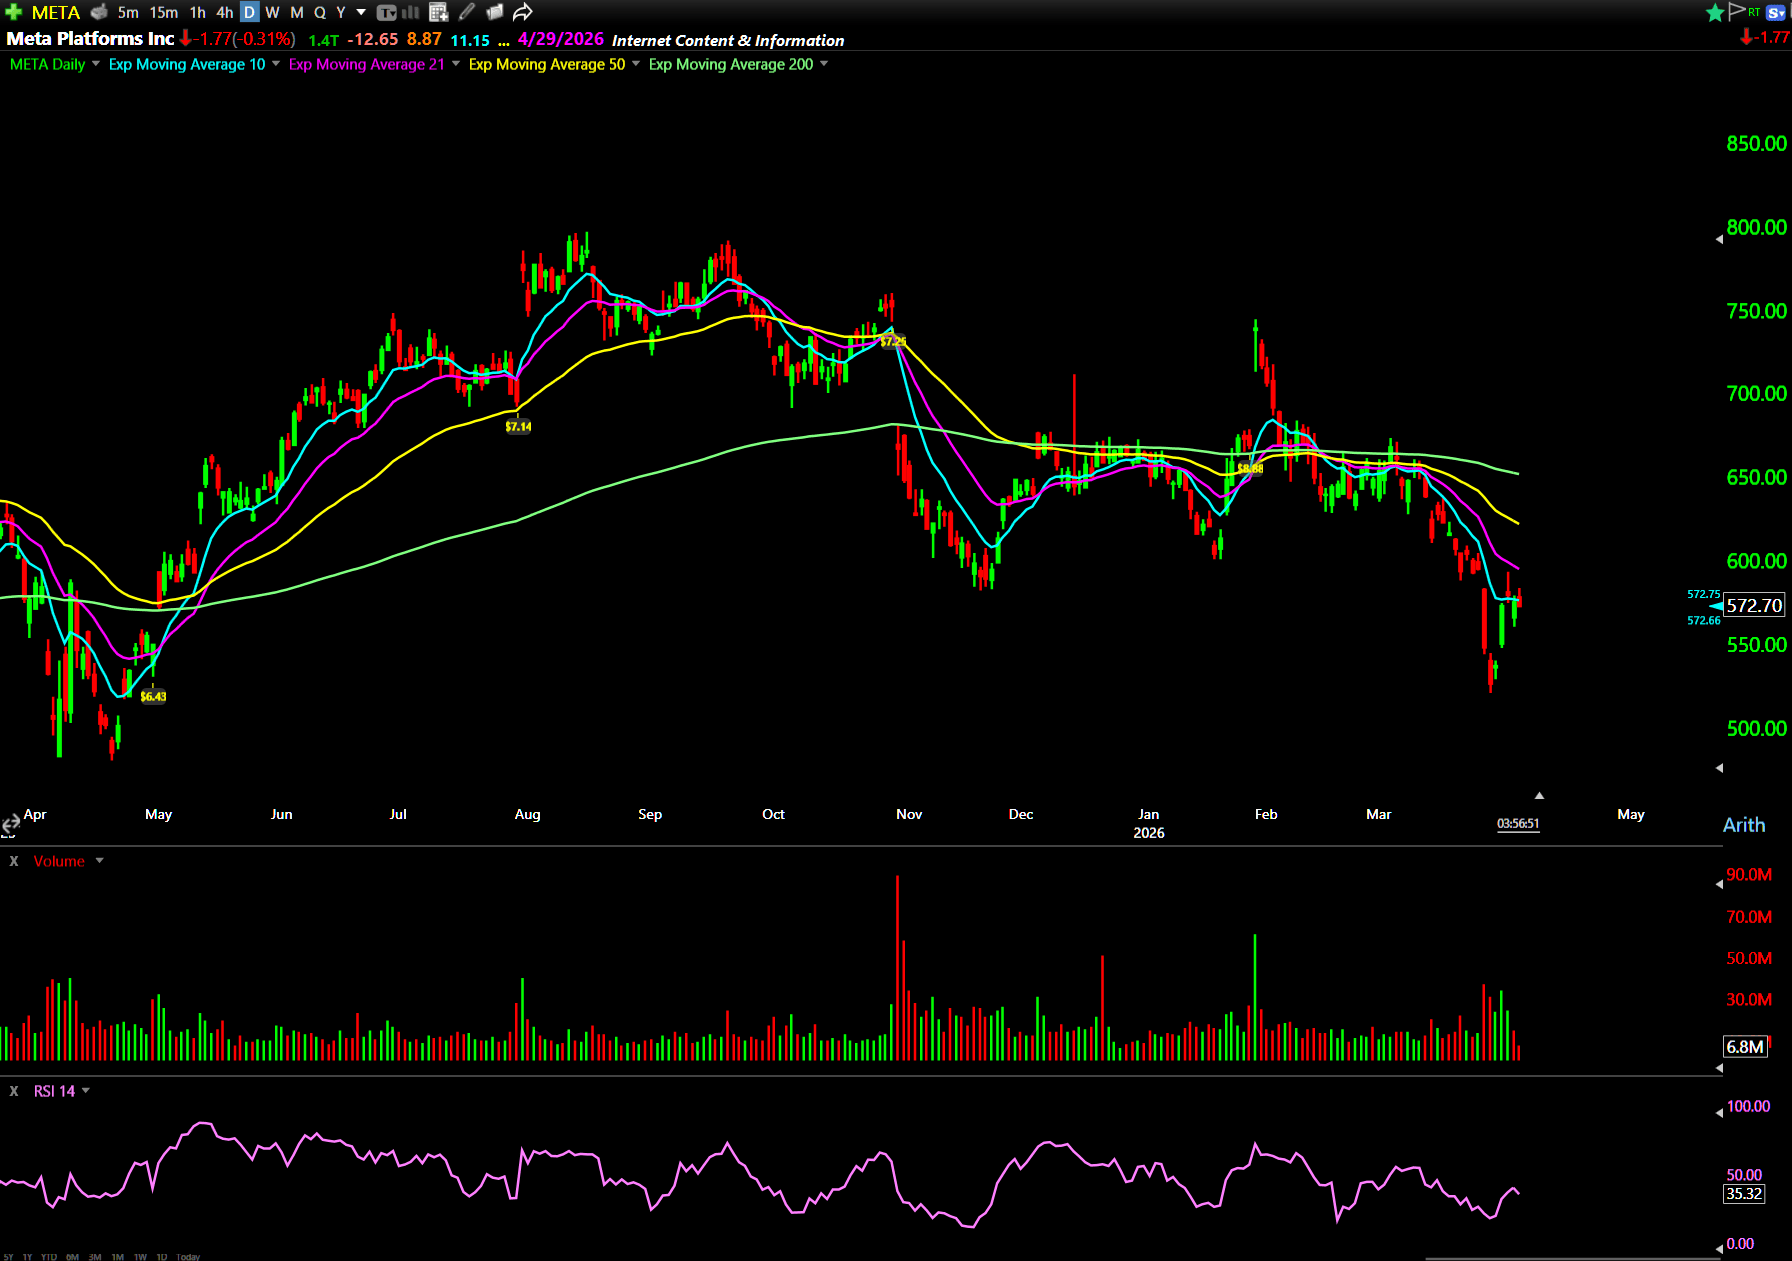
Meta Platforms Inc. (NASDAQ: META) has a potential cup-and-handle structure developing. A breakout above the pre-market highs around $580 could open the door for continuation toward $600. This is a longer-term swing setup, not a day trade.
And The #1 Biggest Setup Of The Week…
A “Capital Wave” is coming to shore. Actually, it’s a gigantic tsunami of trading potential (and it’s coming straight for U.S. stocks)…

This wave has historically delivered moves of 2,700%*, 5,000%*, even 10,000%* … and it could return to the stock market this week.
My buddy Tim Bohen (Lead Technical Trainer and Co-founder at StocksToTrade) is pulling back the curtain on the full story, including why this coming wealth-transfer event could hit just days from now.
More importantly, he’ll show you how he’s zeroing in on one specific stock this Capital Wave could crash into before it hits the beach.
Are you gonna ride the wave or get swept away?
Your next big trade starts here.
It All Comes Back To The VIX
The VIX is trending upward and sitting around 25 right now. Down from 30 but still elevated compared to the 14-16 range we saw earlier this year.
If we start breaking back below 24, then 23.5, and eventually 21, that’s when you could see a meaningful shift in market character. Shorts who have been positioned for more downside will start getting squeezed. Funds sitting in cash will start deploying. That’s where a real rally becomes possible.
Until then, I’m staying selective. The setups are readable. The options flow is showing institutional interest. Momentum appears to be shifting.
But with the VIX still elevated and major catalysts hitting every day this week, I’m not forcing anything.
Patient traders take money from impatient traders. Be in the first category (especially right now).
Be good (and be good to others),
Ben Sturgill
*Past performance does not indicate future results