Happy Friday, traders…
Earnings season has a way of cutting through the noise in the market.
The amateur commentary fades, the predictions fall away, and what’s left are the cold, hard results.
This was one of the most jam-packed earnings weeks of the year, and the reports told us a lot…
Big names delivered surprises, charts developed new patterns, and setups formed where most people least expect them.
For options traders, this is where preparation meets opportunity. Earnings reports change the narrative, leading to setups that didn’t exist a week ago.
I’ve pulled together the biggest earnings movers and the charts that matter most. For many companies, these weren’t just routine quarterly updates, they were moments that reshaped the landscape (and set the stocks forward on new trendlines).
Here are the earnings moves I’m paying close attention to right now…
Advanced Micro Devices Inc. (NASDAQ: AMD)
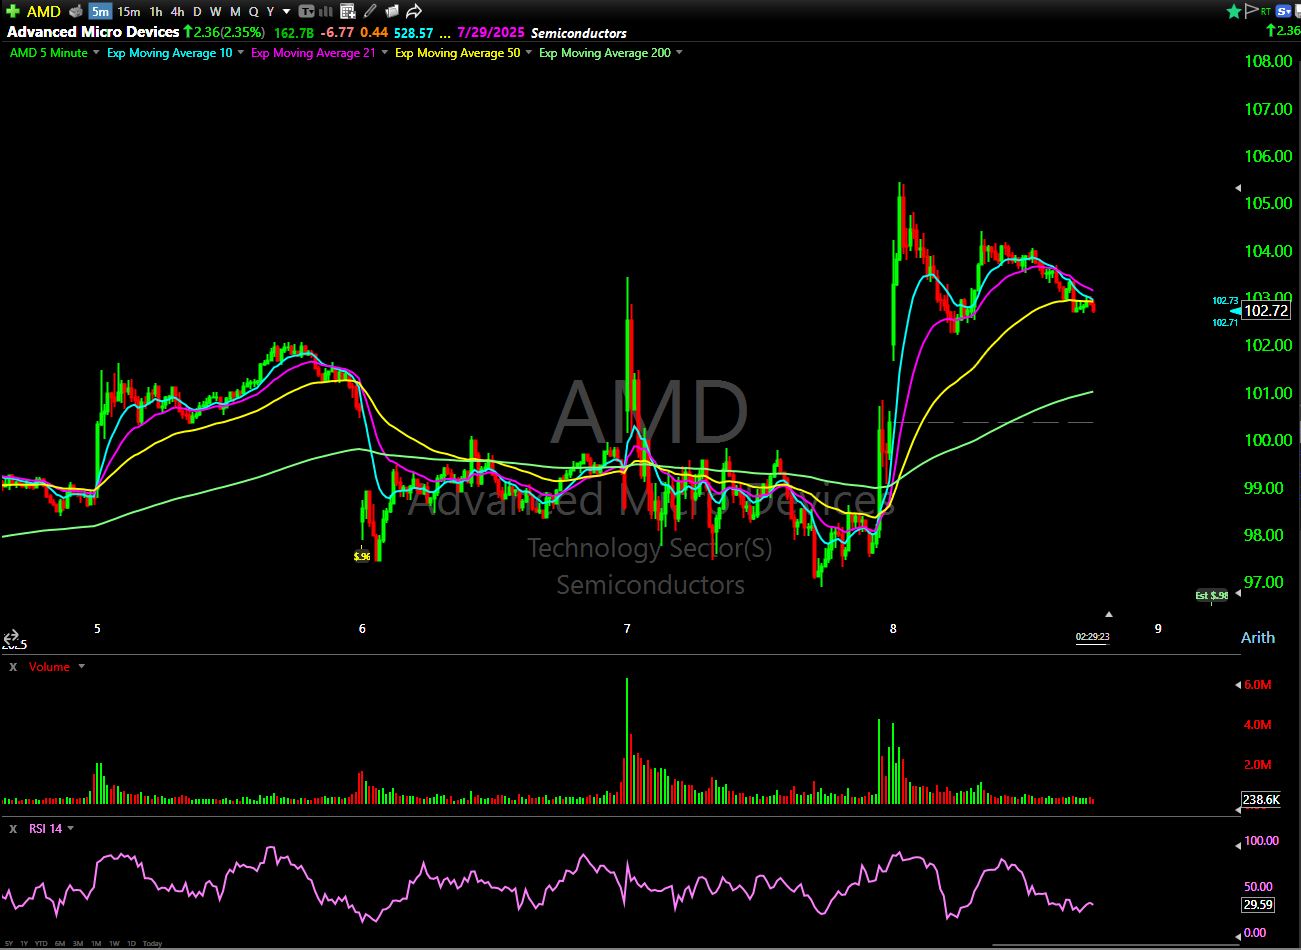
One of the most impressive beats came from chipmaker AMD.
The company’s revenue jumped 36% year over year, staggering for a company of its size. You’d be hard-pressed to find another large-cap company pulling that off right now.
And after a few years of lagging the rest of the semiconductor sector, this huge earnings gain could be the catalyst that sets AMD off on a new uptrend.
Nvidia Corporation (NASDAQ: NVDA)
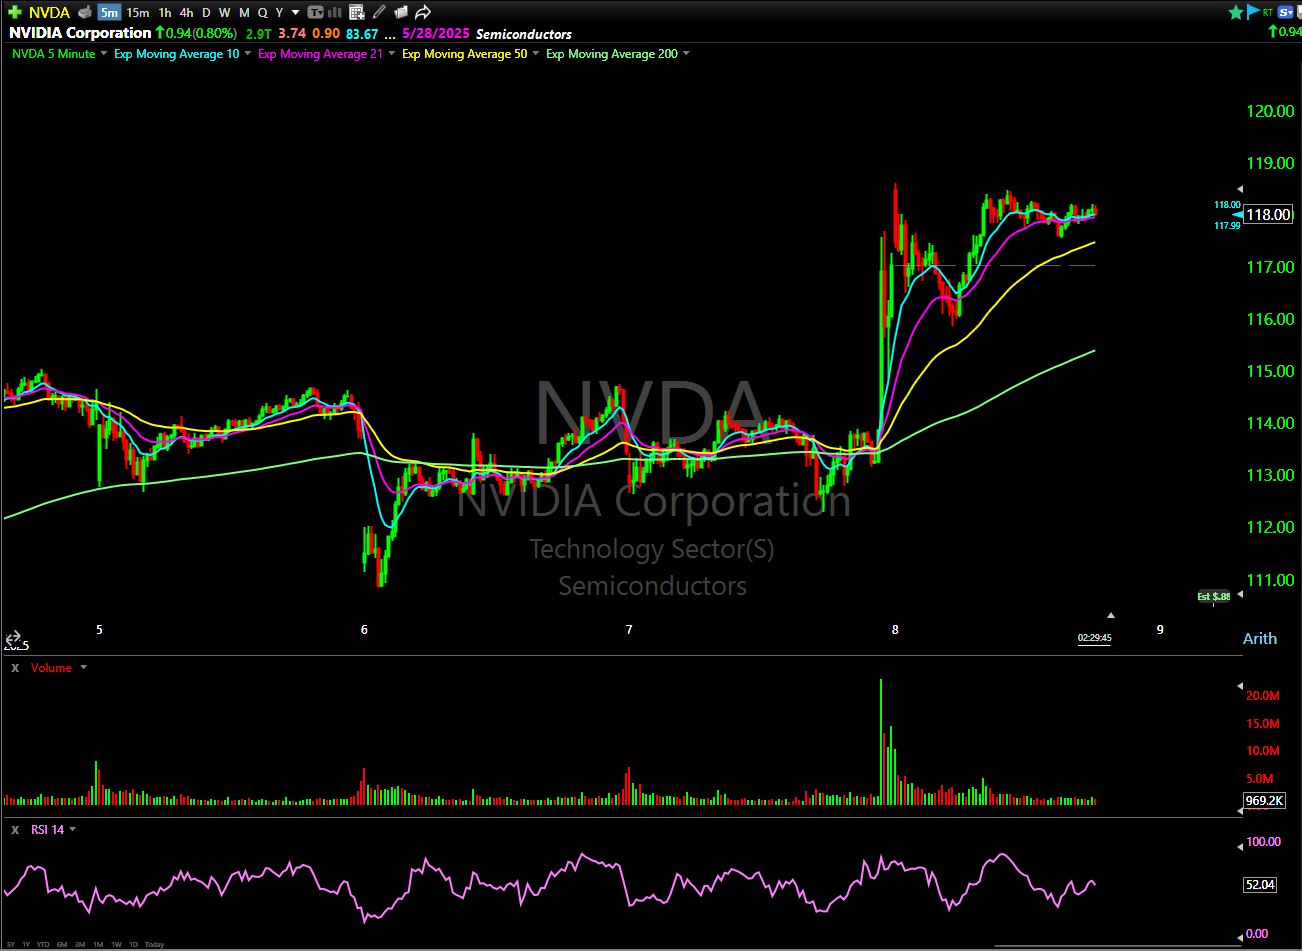
Speaking of semis, we have to discuss Nvidia.
No introduction necessary, this chart is a monster, and the pattern I’m seeing suggests a strong setup going into earnings on May 28.
Big tech isn’t slowing its CapEx spending, and Nvidia is poised to benefit in a big way. I’m eyeing a breakout if it can clear the $120–$125 area, with a potential run toward $140 as we head closer to earnings.
With about 20 days to go, the clock’s ticking, and I want to be positioned early.
Palantir Technologies Inc. (NYSE: PLTR)
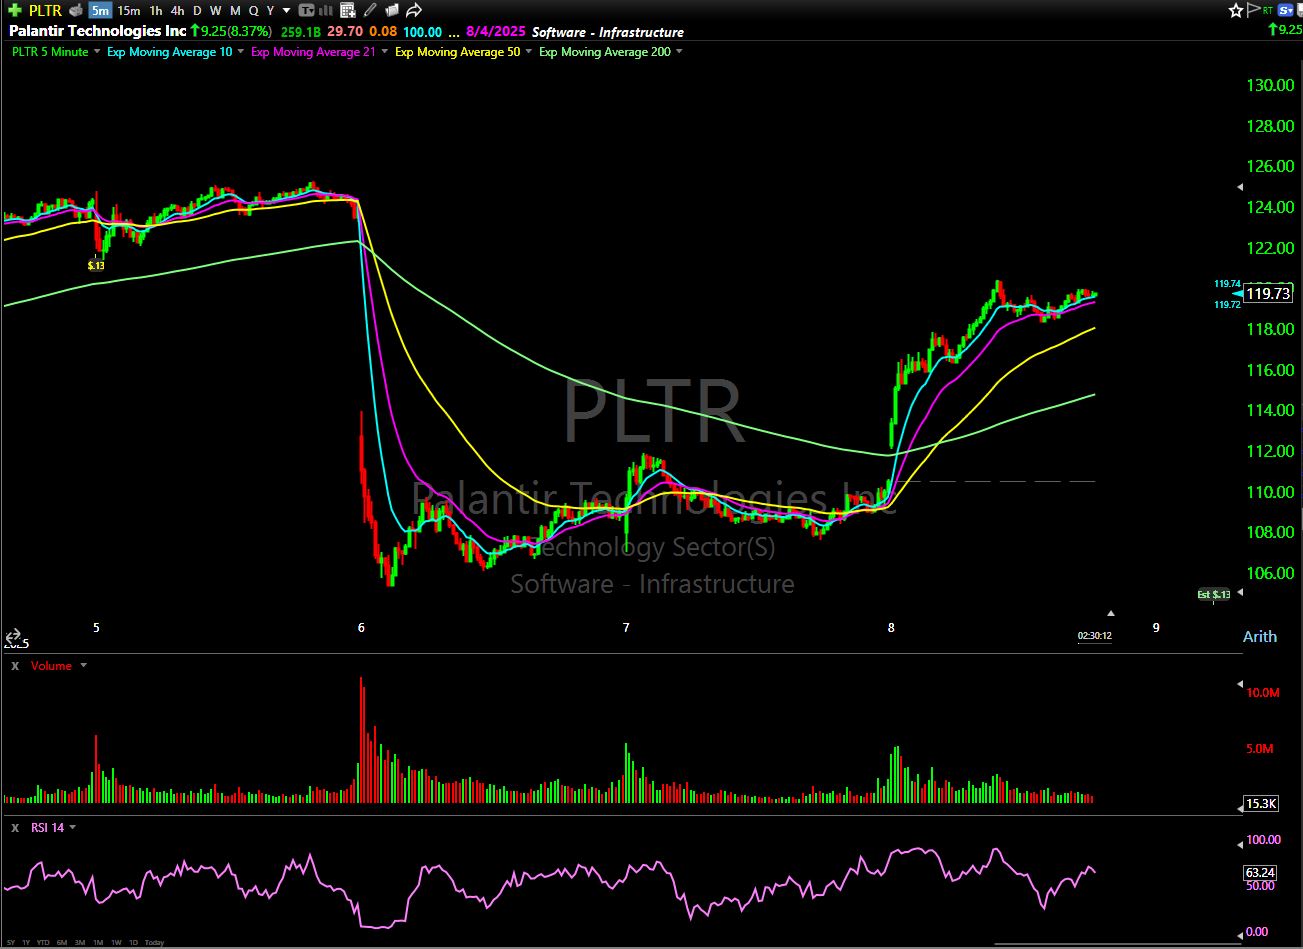
We also can’t ignore the action in Palantir Technologies and CrowdStrike.
Both names surged to all-time highs before pulling back, a reminder that bullish earnings moves often see quick reversals.
It’s a common pattern at these levels: you need a truly blowout report to push through resistance.
But if the numbers are good, those dips are usually buying opportunities.
If you look at PLTR, it’s regained almost the entire dip already. And that’s why I mentioned it earlier in the week.
Walt Disney Co (NYSE: DIS)
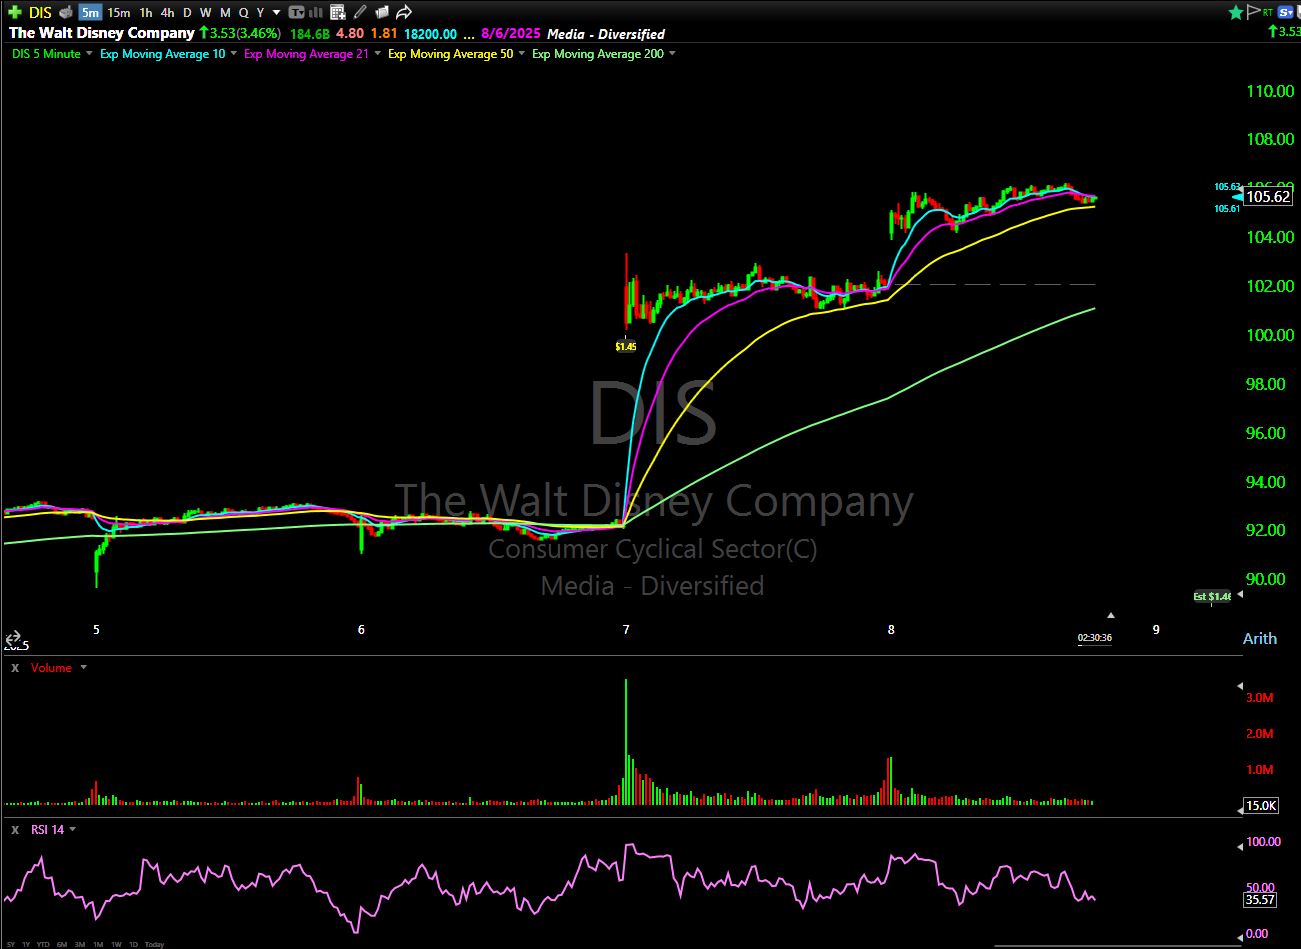
Disney deserves a mention, too. Bob Iger’s return is finally showing up in the numbers, and Disney just raised its guidance.
The stock has been one of the bigger winners this week, and while the investor presentations can be long and dry, it’s worth knowing where the improvement is coming from.
The important number in this report was the theme park segment, which accounts for 40% of Disney’s earnings.
Revenue in the Parks, Experiences and Products segment rose 13% year-over-year to $8.4 billion — strong growth driven by higher attendance and spending at theme parks and cruise lines.
Once you learn to skim the key parts of a balance sheet or income statement, you’ll start spotting what matters without needing a PhD in accounting.
NuScale Power (NASDAQ: SMR), Oklo (NYSE: OKLO), Cameco (NYSE: CCJ)
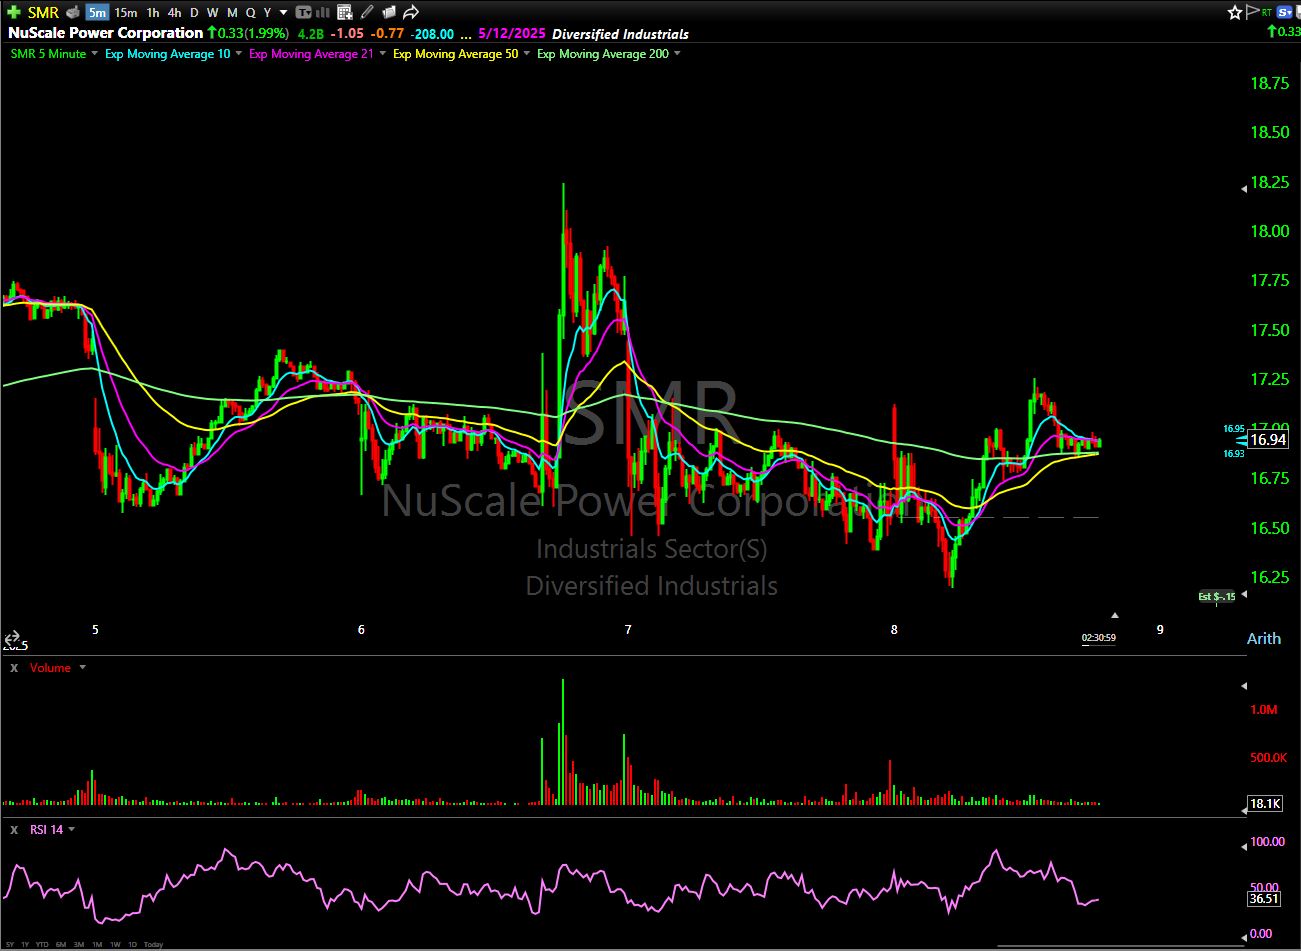
The nuclear power sector has been another surprising mover, sparked by headlines out of the White House.
Names like NuScale Power, Oklo, and Cameco caught serious order flow.
Whether this turns into a lasting trend or is just a momentary pop remains to be seen, but the sector is on my watchlist.
If the volume comes back in and SMR can take out its recent highs, it might shape up as a solid trade.
ServiceNow (NYSE: NOW)
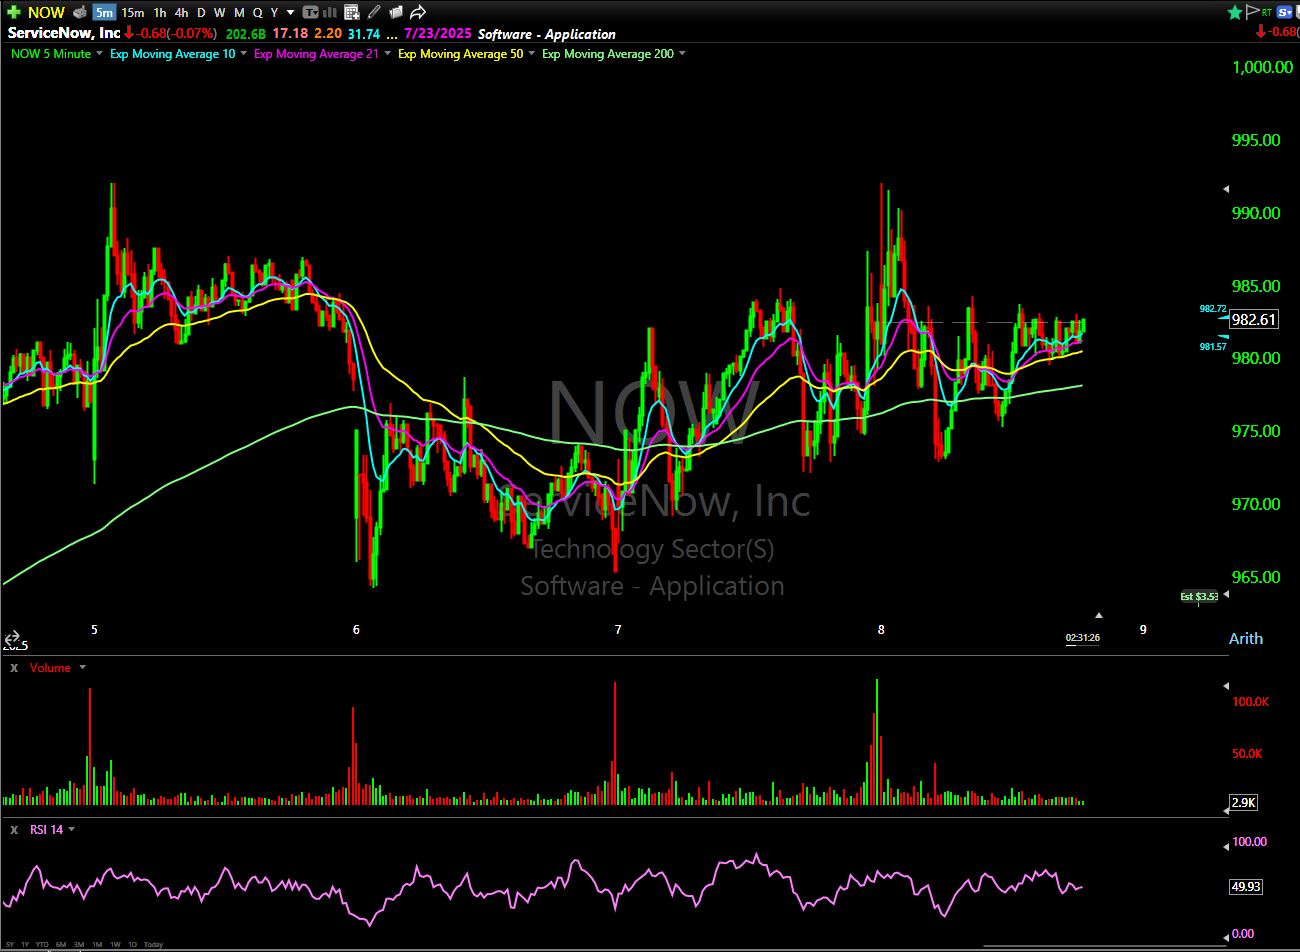
This is what I call a “spicy” play: ServiceNow.
Post-earnings, it’s gapped from the $800s to nearly $1,000, and we rarely see options flow in this name because of the high premiums.
But this week, contracts have been flying into the OMEN Scanner, which tells me smart money is sniffing around.
This one’s risky, no sugarcoating it. If you play something like NOW, you need to treat it with the precision of a zero-day option: tight stops, quick decisions, and clear targets.
Mobileye Global (NASDAQ: MBLY)
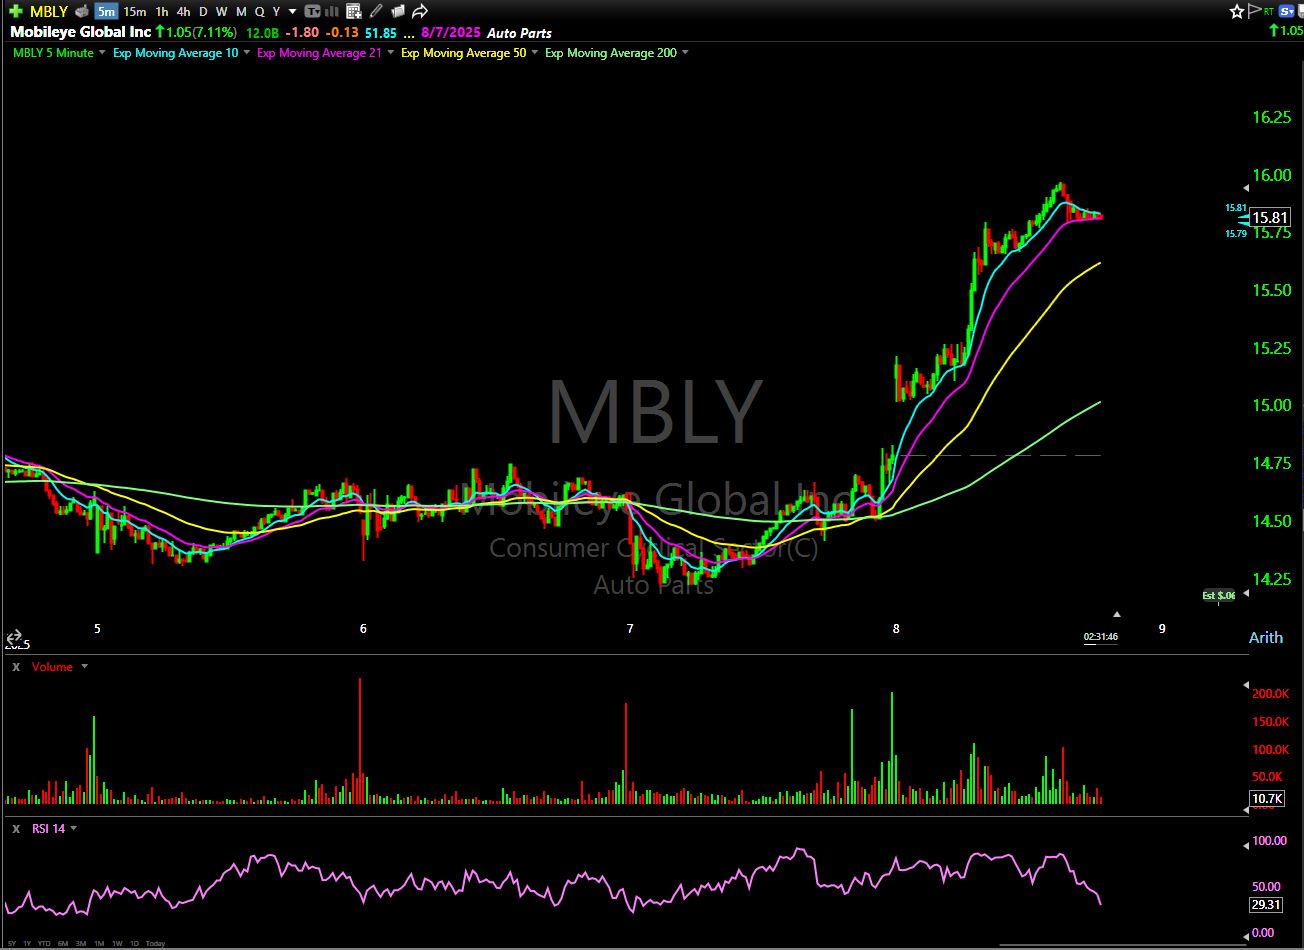
Mobileye Global has been carving out a nice flag pattern after its earnings, which showed a move to profitability.
With a higher low on the chart and short-term support holding, a push through resistance could open the door to the $16–$17 zone.
I’d keep an eye on spreads, open interest, and short-term contracts that fit your style.
The Market Backdrop
All of this is happening against a backdrop of shifting headlines — including U.S.–China talks and global tensions that continue to whip the market around.
Meanwhile, the Federal Open Market Committee (FOMC) meeting has wrapped: Chairman Jerome Powell held rates steady. No surprise there, but the final decision removed some uncertainty.
This week’s batch of earnings reports showed us momentum, sector pops, and clean technical setups.
Watch these charts heading into next week for potential continuation.
Happy trading,
Ben Sturgill
P.S. If you want access to the system that achieved an 89% win-rate with a 72% average gain…*
From which the top 120 trades have ALL generated 100% or higher — with 27 soaring above 200%, and 12 exploding beyond 300%…*
Then NOW is the time to start using my OMEN System.
Join the great Aaron Hunziker, TOMORROW, May 10 at 12:00 p.m. EST for a LIVE OMEN TRAINING SESSION.
Space is limited — Click here to reserve your seat.
*Past performance does not indicate future results