For the first three months of 2026, I focused (almost) exclusively on pullback setups.
The VIX was in an utterly perfect uptrend. Stocks were wobbly, choppy, and uninviting. The better risk-reward was to wait for charts to pull back to support, confirm the level was holding, and then get in.
False breakouts were everywhere because the broader market had no follow-through.
But April has kicked into a completely different gear. The market has (correctly) decided the Iran War is at a stalemate. The VIX broke its uptrend. State Street SPDR S&P 500 ETF Trust (NYSEARCA: SPY) has gone parabolic to the upside.
Breakouts are back, baby…
After thousands of trades, I’ve noticed the best breakouts leave clues before they truly blast off.
And once I learned to spot those signs early, I started crushing these setups over and over again.
Let me walk you through the early signals I look for in a breakout, so you’re already in the options when they start exploding to the upside.
What Makes a Breakout Worth Trading?
A breakout happens when a stock breaks above a key resistance level (a price the stock has historically struggled to trade above).
These levels are like invisible walls on the chart, and when they break, huge moves to the upside often follow.
When this happens on strong trading volume, it’s often a signal that a new uptrend is starting.
It can be truly glorious to watch a daily chart break out on huge volume into blue-sky, never-before-seen price discovery.
But after thousands of options trades, I’ve learned to watch what happens before the breakout.
Some breakouts run for days. Others fail instantly (fakeouts).
And the difference almost always comes down to the quality of the setup in its early stages, before the breakout actually happens.
Here’s what I look for in every breakout pattern:
- Tight consolidation near a clear resistance level
A strong breakout usually comes after price action gets quiet and compressed right under resistance. If the candles are getting smaller and overlapping, with clear support holding underneath, that’s a positive sign. - Volume gradually picking up into the setup
You don’t need a massive volume spike right away. But when volume starts to increase slightly on up days, that shows buyers are getting active early. It’s a sign that demand is building. - Clean levels with repeat tests
A strong breakout level gets tested multiple times. The more often a stock knocks on the same ceiling, the more likely it is to break through with strength when it finally clears it. - Orderly charts with consistent price action
If the chart is wild or full of failed breakouts and fakeouts, I usually pass. The best setups look obvious in hindsight because they followed clean, predictable price behavior.
Prepare Before the Breakout Occurs
Once I find a breakout setup, I mark my level, define my risk, and set an alert.
I want an email, a text message, and a desktop notification when that level breaks.
I won’t jump the gun and buy into resistance. I need the stock to prove it can break out and follow through.
I wait for the breakout to happen with confirmation. The price should move through resistance with strength and increased volume … a clear shift in momentum.
The trick is to do all your prep work before that happens. That way, when the move triggers, you’re ready to act immediately, with your pre-defined levels, according to your plan.
Now, let me show you what these patterns look like on the chart…
2 Beautiful Breakout Examples
Gold is one of the best long-term breakout examples in recent memory…
For four years, the SPDR Gold Trust (NYSEARCA: GLD) was rangebound between $150 and $193.
Time and time again, it would attempt to break out into the $200s and fail…
But in March 2024, that changed. GLD finally made the break above $193 on heavy volume.
And look what happened next:
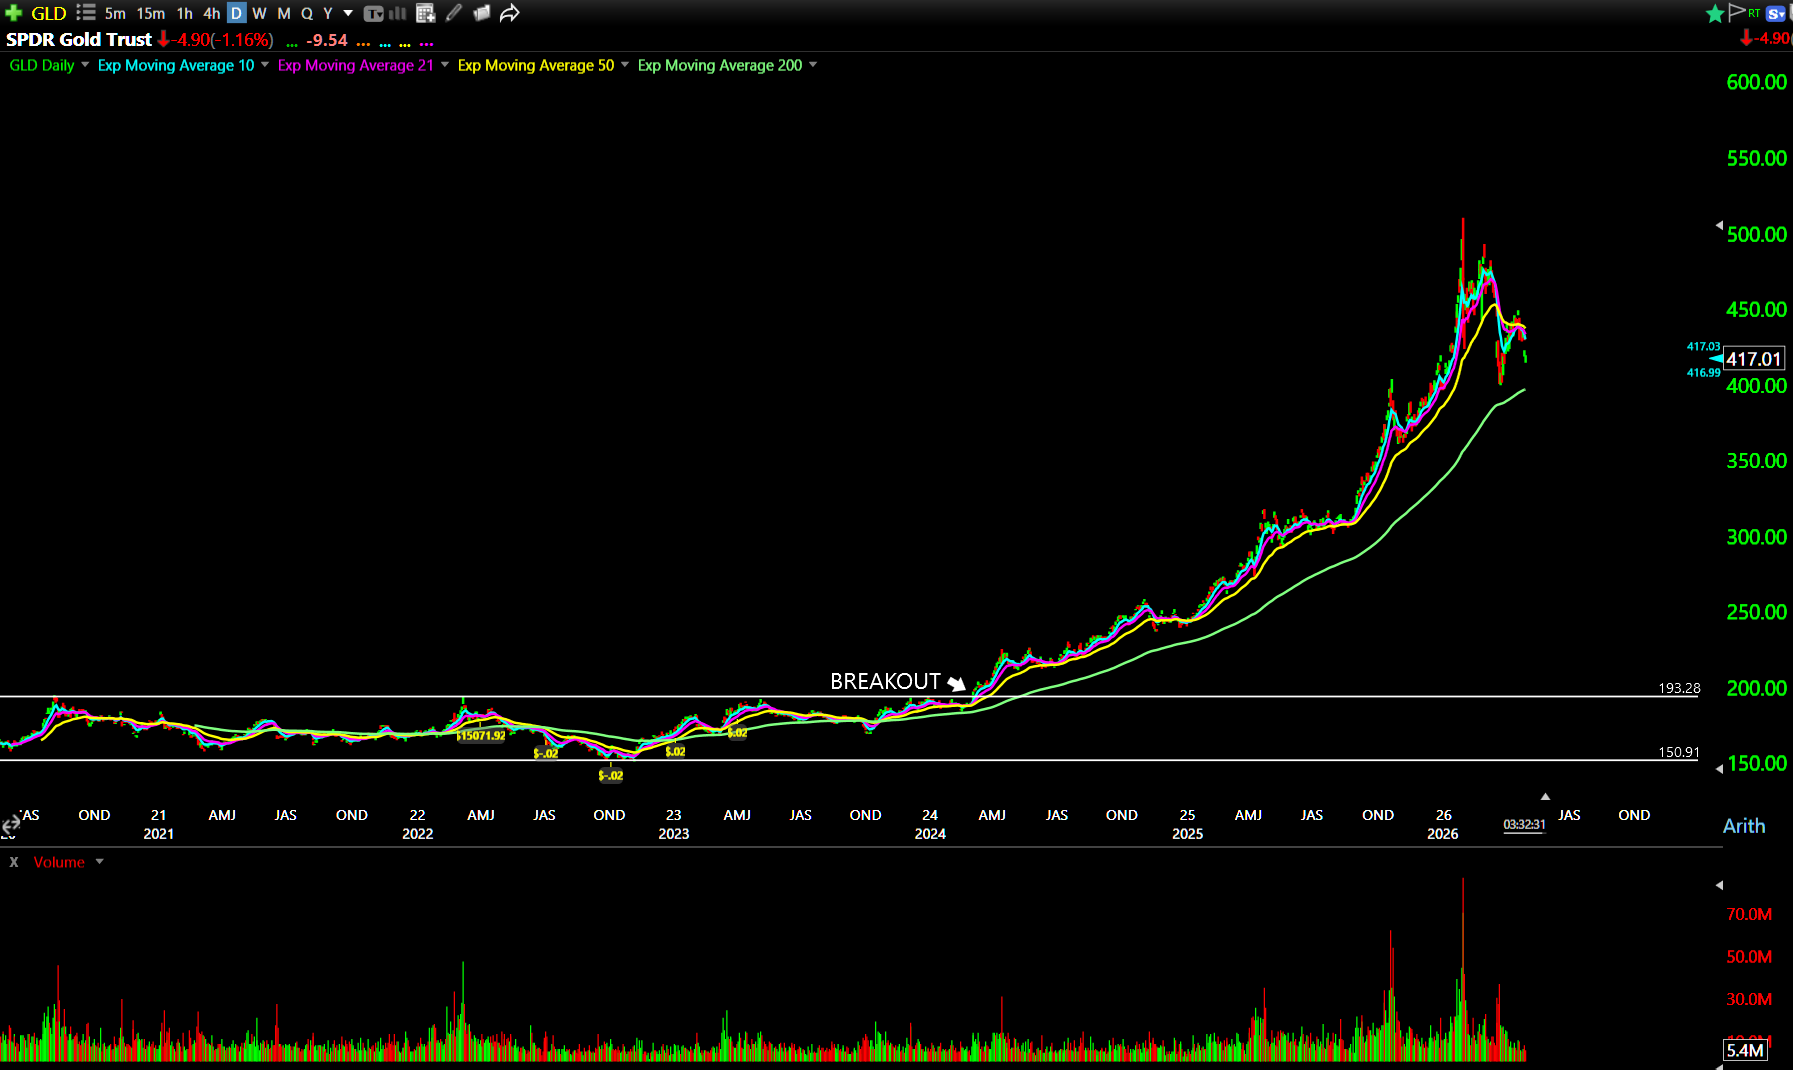
Since breaking above $193, GLD surged 160% in less than two years.
And in hindsight, we could see the structure forming throughout all of 2023.
When the stock finally broke above $193, it entered a perfect uptrend and never looked back…
That’s one of the most dramatic long-term breakout examples in recent history.
But let’s look at a VERY recent one: Intel Corporation (NASDAQ: INTC):
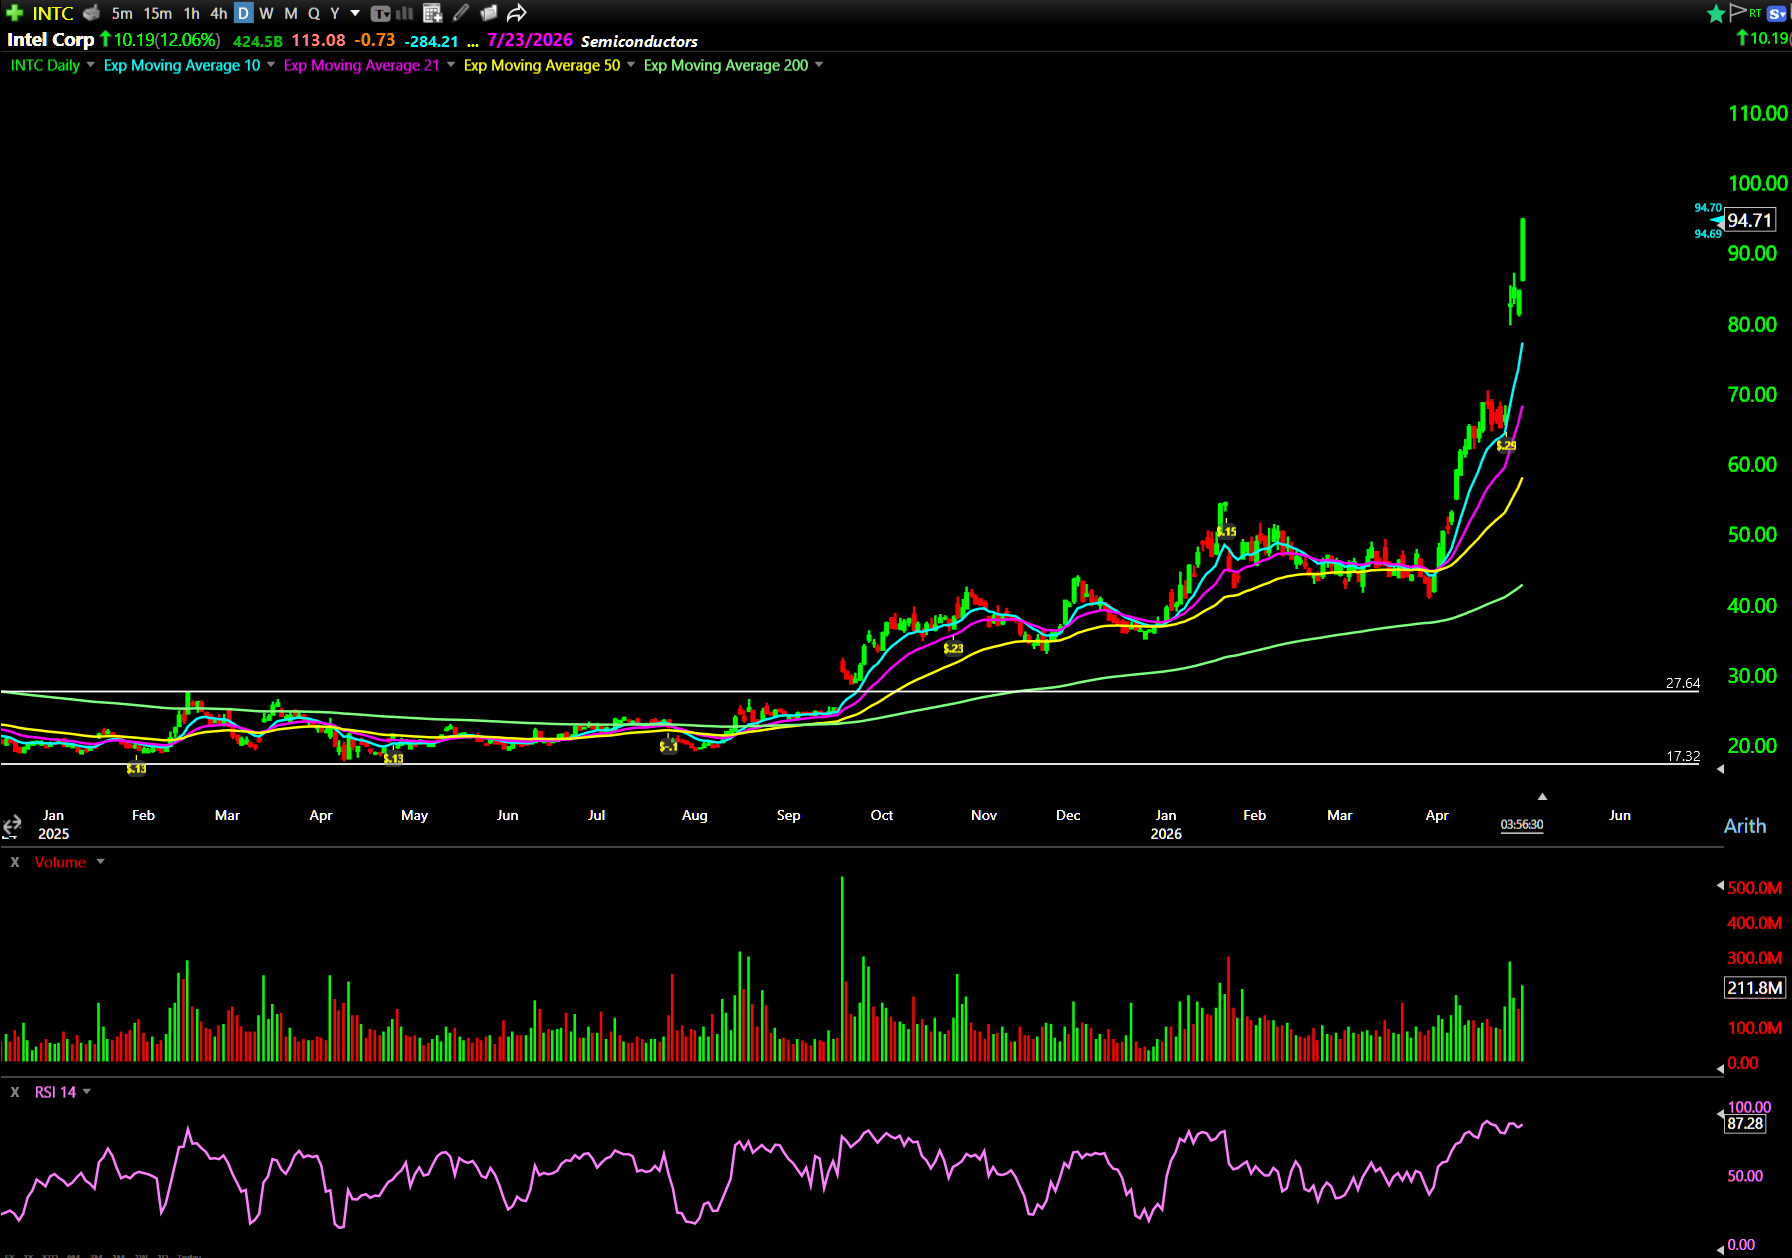
Same story as GLD from 2020–2024, INTC was locked in a prison between $17 and $27 for all of 2025.

As soon as it gapped above $27 (on the single-highest volume day for the stock in years), it proceeded to go on a 7-month, 220%+ run.
And it’s still going, up 40% in the past week alone.
Long-term breakouts are extremely powerful. If you can get in at the right time…
The next time you see a chart keep trying to break resistance on higher and higher volume, don’t ignore it. Take a closer look.
That kind of understated strength might just lead to a massive breakout.
Happy trading,
Ben Sturgill
*Past performance does not indicate future results