Happy Friday, traders…
What’s your plan this weekend?
If you think about how you spend your days off, I’m sure you’ll find some mind-numbing waste of time…
Maybe it’s Netflix binges. Maybe it’s video games. Maybe it’s doom-scrolling on social media.
No matter what it is, I bet you can think of one activity — something that doesn’t further your trading goals — that could be replaced with something that does.
The best traders won’t stop working when the closing bell rings this afternoon.
They’ll spend the next few days reviewing their last few trades, analyzing charts to identify setups, and using those setups to build a watchlist for next week.
If you think you can sit on the couch all weekend only to show up and crush the market on Monday morning … you’re in for a rude awakening.
Not to say you can’t have fun. Taking some time to completely disconnect from your screens is healthy.
But if you aren’t studying at all, you’re missing one of the best opportunities for quiet, reflective analysis … free from the craziness of a normal trading day.
Take These 3 Steps This Weekend. You’ll Be Better Prepared Come Monday Morning…
Use the Weekend to Analyze Your Charts
I’m a technical trader. Chart patterns give me the conviction to take trades based on Smart Money sweeps.
That’s where my edge comes from. I’m watching the charts and trusting the setups.
But it’s tough to find time to mark up charts during market hours.
When I’m trading, I’m usually zoomed in on the 5-minute chart, watching the intraday action play out.
I’m focused on trading, not on notating. The market is moving too fast, and there’s not enough time for technical analysis.
That’s why I set aside time on the weekends to go through daily and weekly charts for names I see getting hammered on the OMEN Scanner.
I often find the best setups during these sessions. No noise … just quiet study time that leads to solid trading ideas.
How to Chart the Levels That Matter
If you read my watchlists or watch my webinars, you’ve probably noticed that I always talk about the importance of key price levels.
This is because key price levels have arguably helped me more than any other technical indicator throughout my trading career.
I use these levels as goalposts for my trading, mapping out areas of support and resistance.
If a stock regularly bounces at a certain price on the way down … that’s support.
If a stock regularly fails at a certain price on the way up … that’s resistance.
Look at this Micron Technology Inc. (NASDAQ: MU) chart for a perfect example of support and resistance (and how I would notate it):
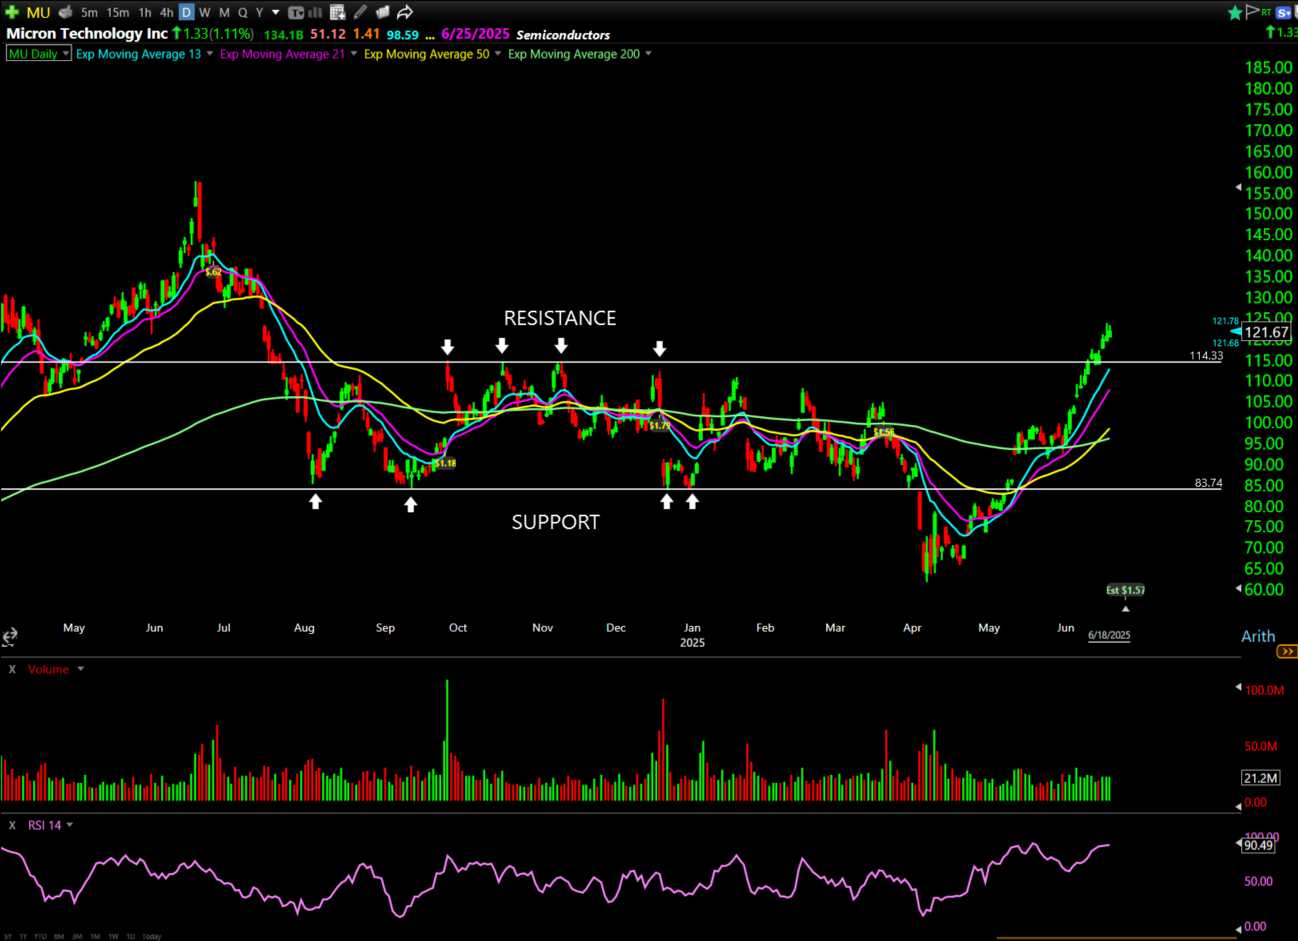
As soon as the stock broke below the $83 support in April, it had its biggest red candle in months.
As soon as the stock broke above the $114 resistance, it posted six green days in a row (and counting)…
Again, these are not coincidences.
After 22 years of looking at charts, I’ve noticed a consistent trend around key price levels…
They tend to correspond with big round numbers.
Traders have a psychological sensitivity to round numbers like $10, $50, $100, $500, etc.
Time and time again, you’ll see stocks bounce (or fail) near these critical levels.
This isn’t a coincidence; it’s psychological resistance.
If you can grasp how to identify key price levels, you’ll give yourself a superpower in the stock market.
There are a few key things I always look for when I’m studying a chart. If I spot them, I mark them up immediately:
- Draw horizontal lines at support and resistance levels for a visual placeholder of the stock’s current trading range.
- Draw vertical lines at key moments in the chart’s history to help you see the visual story of a stock’s past big moves.
- Draw trendlines under uptrends and downtrends to see the general direction of recent price action.
These are simple annotations that make my charts easier to read, and the weekend is the best time to do this analysis.
I might sound like your parents telling you to eat your vegetables.
You may not like broccoli as much as pizza, yet you know it’s good for you. And you might not like studying as much as the trading itself…
But remember: Winners do the hard work that losers aren’t willing to do.
Happy charting,
Ben Sturgill
P.S. Don’t do your weekend work alone…
Join Danny Phee this SUNDAY, June 22 at 8:00 p.m. EST to see how my brand-new day tool can transform your strategy overnight.
Seats are limited — Click here to save yours now.
*Past performance does not indicate future results