Good morning, traders…
Tuesday morning, I bought Apple Inc. (NASDAQ: AAPL) Feb 6 $270 Calls at $2.25.
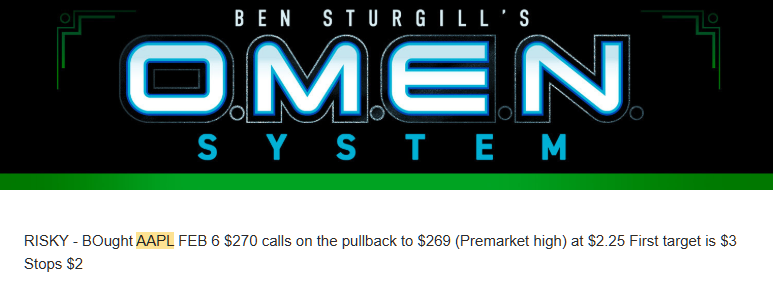
The stock had pulled back to $269, the premarket high acting as support.
The chart looked better than every other major tech stock.
At the same time, I saw millions of dollars in Smart Money calls hitting my OMEN Scanner.
I positioned and waited.
Wednesday morning, the Nasdaq opened down and kept falling.
Tech stocks got obliterated, with software names leading the decline.
By midday, the Nasdaq was down 2.5%.
But while that was happening, AAPL was solid green.
And I was scaling out of 122% gains in less than 24 hours.*
There Are 2 Reasons Why I Nailed An Overnight Double…
What Caused The Selloff
Wednesday’s selloff came from three things converging at once.
Tech rotation. A broad selloff hit technology and software stocks due to…
AI disruption fears. Claude added new AI capabilities, fully automating tasks like legal document review, contract summarization, and marketing automation.
The fear spread beyond legal tech to all enterprise software.
Profit-taking. Some of these high-flying tech names were getting wildly overextended.
Software, obviously. But the memory and storage plays that had been on massive runs got hit the hardest.
SanDisk (SNDK), Western Digital Corp. (NASDAQ: WDC), and Micron Technology Inc. (NASDAQ: MU) were all down double digits (telling us this was an unwinding of momentum).
The Pullback To Support
On Tuesday morning, AAPL pulled back to $269 (the premarket high):
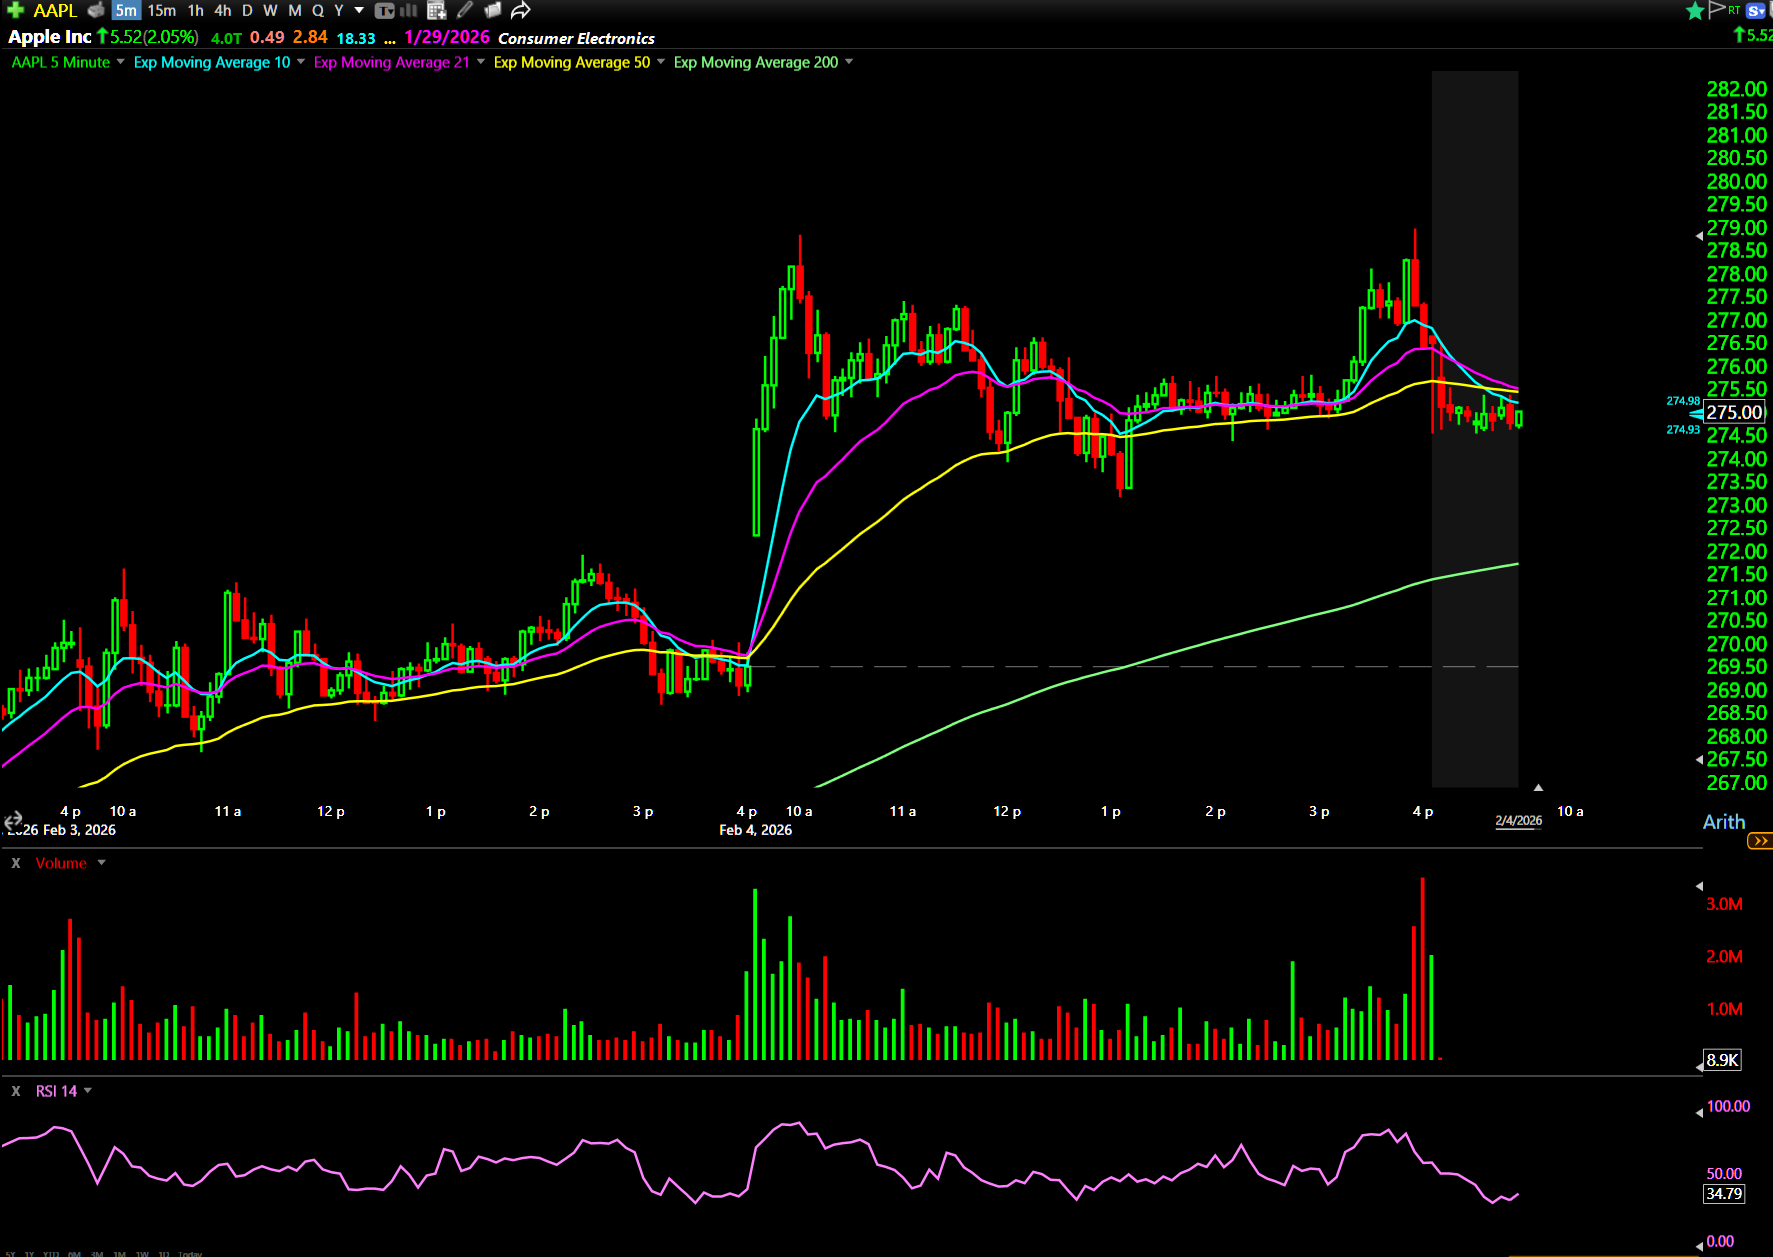
Premarket highs often act as support on pullbacks because that’s where institutional buyers stepped in before the regular session.
The stock was testing that level, but it wasn’t breaking down like its peers. It was consolidating at support (what you want to see on a pullback to a key level).
If it broke below $269, I’d exit.
If it held, I had a clearly defined entry with room to run back toward the recent highs.
Risk was defined, and the potential reward was high.
Smart Money Confirmed The Level
While I was watching the chart, I saw millions of dollars in Smart Money flow pouring into AAPL calls.
That flow confirmed what the chart was implying:
Institutions were buying the pullback to $269. They saw the same support level I did.
When Smart Money and technicals align, I pay attention.
While most major tech names were breaking down, AAPL was holding support. The stock looked better than NVIDIA Corp. (NASDAQ: NVDA), better than Microsoft Corporation (NASDAQ: MSFT), better than every name that would go on to get crushed on Wednesday.
AAPL was getting institutional support while the rest of the sector was getting sold.
When the Nasdaq opened down and kept falling on Wednesday, Apple opened green:
That’s what happens when you position in a name showing relative strength at a key support level with institutional backing.
While everyone else was panicking, I was scaling out.
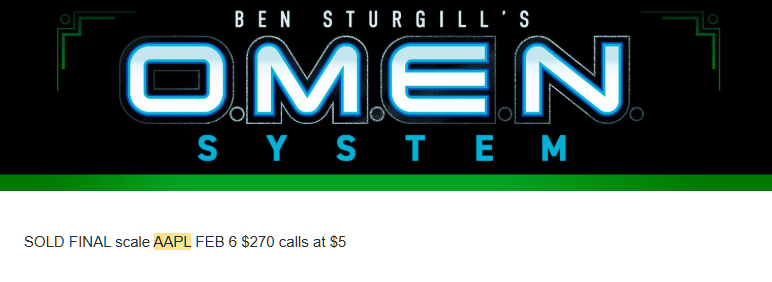
One minute after the open, I sold my final batch.
Why This Setup Worked
Two things had to align for this setup to produce that result:
- The entry at $269 gave me a clean support level where I knew exactly where I was wrong. If AAPL broke that level, the setup was done. But if it held, I had asymmetric risk-reward with small risk below $269 and large reward back toward recent highs.
- The relative strength on Tuesday told me this name could hold when the sector sold off. AAPL wasn’t participating in the weakness that was hitting the rest of tech, and that divergence was crucial.
When both conditions align, that’s when the highest-probability setups form on red days.
What To Watch For Next Red Day
On red days, I look for two things:
Tuesday, both conditions aligned in AAPL.
The stock pulled back to $269, found support at the premarket high, and held while peers broke down.
Relative strength + pullback to support = 122% gains.*
Next time the market sells off hard, look for those two traits, and you just might outperform on a red day.
Happy trading,
Ben Sturgill
*Past performance does not indicate future results