Good morning, traders…
When I played professional basketball in Uruguay, film sessions were mandatory.
Not just highlights, full game tape.
We sat in that film room (sometimes until the crack of dawn), reliving every mistake from the night before.
Nobody wanted to watch themselves blow a layup or lose their man on defense.
But my coach didn’t care.
He’d pause the tape, rewind it, and make us watch the same unforced error three times over. He would repeat, “If you can’t see the mistake, you’ll make it again tomorrow night.”

He was right.
The players who studied the tape made noticeable improvements. The ones who zoned out kept making the same mistakes, game after game, year after year.
That practice has always stuck with me.
In that spirit, I’ve been working on my comprehensive 2025 year-end performance evaluation…
…going through everything trade-by-trade, strategy-by-strategy:
Way too many traders skip this step. They roll into January and trade exactly the same way they did all year.
Even if you had a profitable year, that’s a mistake.
Don’t you want to make even bigger gains next year?
The traders who consistently improve do one thing differently: they identify their mistakes, then systematically eliminate them.
Tim Sykes does this, and he’s made $7.9 million. Jack Kellogg does this, and he’s made $25 million.
Every profitable trader I know does this.
If you skip this step, you’ll keep making the same mistakes in 2026 that you made in 2025.
But if you evaluate your performance honestly, you’ll enter 2026 knowing which aspects of your trading to lean into (and which ones to work on).
Let’s Evaluate Your 2025 Trading Performance…
1. Start With The Right Performance Metrics
A. Absolute Performance
Document these first:
- Starting capital (01/01/2025)
- Ending capital (12/31/2025)
- Net dollar P&L
- Net percentage return
- Average capital deployed per trade
- Max capital deployed at one time
This tells you what happened, then we’ll get to why.
B. Risk-Adjusted Returns (Critical for Options Traders)
Raw returns are meaningless without risk context.
Key metrics to calculate:
- Max drawdown (peak-to-trough)
- Average drawdown
- Recovery time from drawdowns
- Return ÷ Max drawdown ratio
- Worst single-day loss
- Worst losing streak (number of trades and % equity)
A trader who made +120% with a 70% drawdown is notably worse than one who made +60% with a 10% drawdown.
2. Trade-Level Statistics
Create a table or spreadsheet of:
A. Win/Loss Structure
- Win rate
- Average winning trade (% and $)
- Average losing trade (% and $)
- Largest winner vs. largest loser
- Profit factor (gross wins ÷ gross losses)
Red Flags To Watch Out For:
- One or two massive winners accounting for most of the year
- Average losers being larger than average winners
B. Expected Value (Your Mathematical Edge)
This is the most important metric because it calculates whether your trading is mathematically profitable over time, independent of short-term outcomes, emotions, or luck.
To calculate your expected value (EV) per trade:
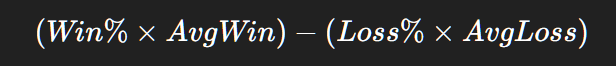
If EV is positive but small, execution and sizing are paramount.
If EV is negative, discipline alone cannot fix the problem. (You need to go back to the drawing board.)
3. Strategy Breakdown
Do not lump all trades together.
Break performance down by:
- Strategy type
- Timeframe
- Same-day / 0DTE
- 1–5 DTE
- Swing options
- Market regime
- Trending bull
- Range-bound
- High-volatility selloffs
- Catalyst-based vs. technical-only trades
For each bucket, calculate:
- Win rate
- EV
- Max drawdown
- Total contribution to yearly P&L
You might find that 20–30% of your setups produced 80% of your gains.
4. Execution Quality Review
Ask these questions trade by trade:
A. Entry
- Did you chase?
- Were you early or late?
- Did implied volatility help or hurt you?
- Did you size based on risk or conviction?
B. Exit
- Did you respect your stops?
- Did you cut winners too early?
- Did you let losers turn into “hold and hope” plays?
- How often did you exit based on emotion vs. rules?
5. Risk Management Audit
This section determines whether your results are repeatable.
A. Position Sizing
- % of account risked per trade
- Largest single-trade risk as % of equity
- Consistency of sizing (or lack thereof)
B. Correlation Risk
- Multiple trades on the same sector or theme
- Overlapping expiration risk
- Opportunity cost
6. Psychological Performance Review
Be brutally honest.
Evaluate:
- Overtrading frequency
- Revenge trading instances
- FOMO entries
- Trades taken outside your plan
- Trading during emotional states (fatigue, anger, boredom)
Then compare your profitability across those categories.
7. Compare Against Proper Benchmarks
Do not compare yourself to social media traders.
Use:
- S&P 500 total return (passive benchmark)
- Buy-and-hold QQQ
- Cash yield (risk-free rate)
- Your own 2024 performance
8. Capital Efficiency Analysis
- Return per dollar of premium deployed
- Capital tied up vs. idle
- Slippage and commissions as % of profits
9. Narrative Review (Write This Out)
This is not optional.
- What worked in 2025?
- What clearly did not work?
- What setups felt easiest to execute?
- Where did I break my rules most often?
- If I traded only my top 3 setups, what would returns look like?
The answers to this worksheet become the foundation of your 2026 plan.
Happy trading,
Ben Sturgill
*Past performance does not indicate future results