Good morning, traders…
I “just did it…”

…meaning I closed a killer trade on Nike Inc. (NYSE: NKE).
On December 24, I entered the NKE January 16 $62.50 calls at $0.95.
Throughout the week, I scaled out at $1.00, $1.29, $1.42, and $1.60.
On December 31, I sold my final scale for $1.90.
100% gains in 7 days…*
Clean setup, perfect entry, disciplined scale-outs, exit at target.
Everything worked exactly as planned. And I stuck to my 2026 commitment to take profits earlier.
But I never would’ve found this setup without my Options Income Scanner…
The scanner flagged these NKE calls way before the move happened. It showed me exactly where the Smart Money was positioning. It gave me the confirmation I needed to enter the trade before everyone else caught on.
As we speak, you’re probably looking at charts trying to find your next trade. You’re scanning dozens of tickers, wondering which ones are about to move.
But you’re wasting time on names the institutional whales have no interest in.
The Options Income Scanner solves that problem.
It zeroes in on the biggest Smart Money plays like a heat-seeking missile.
Let Me Show You How My Options Income Scanner Can Help…
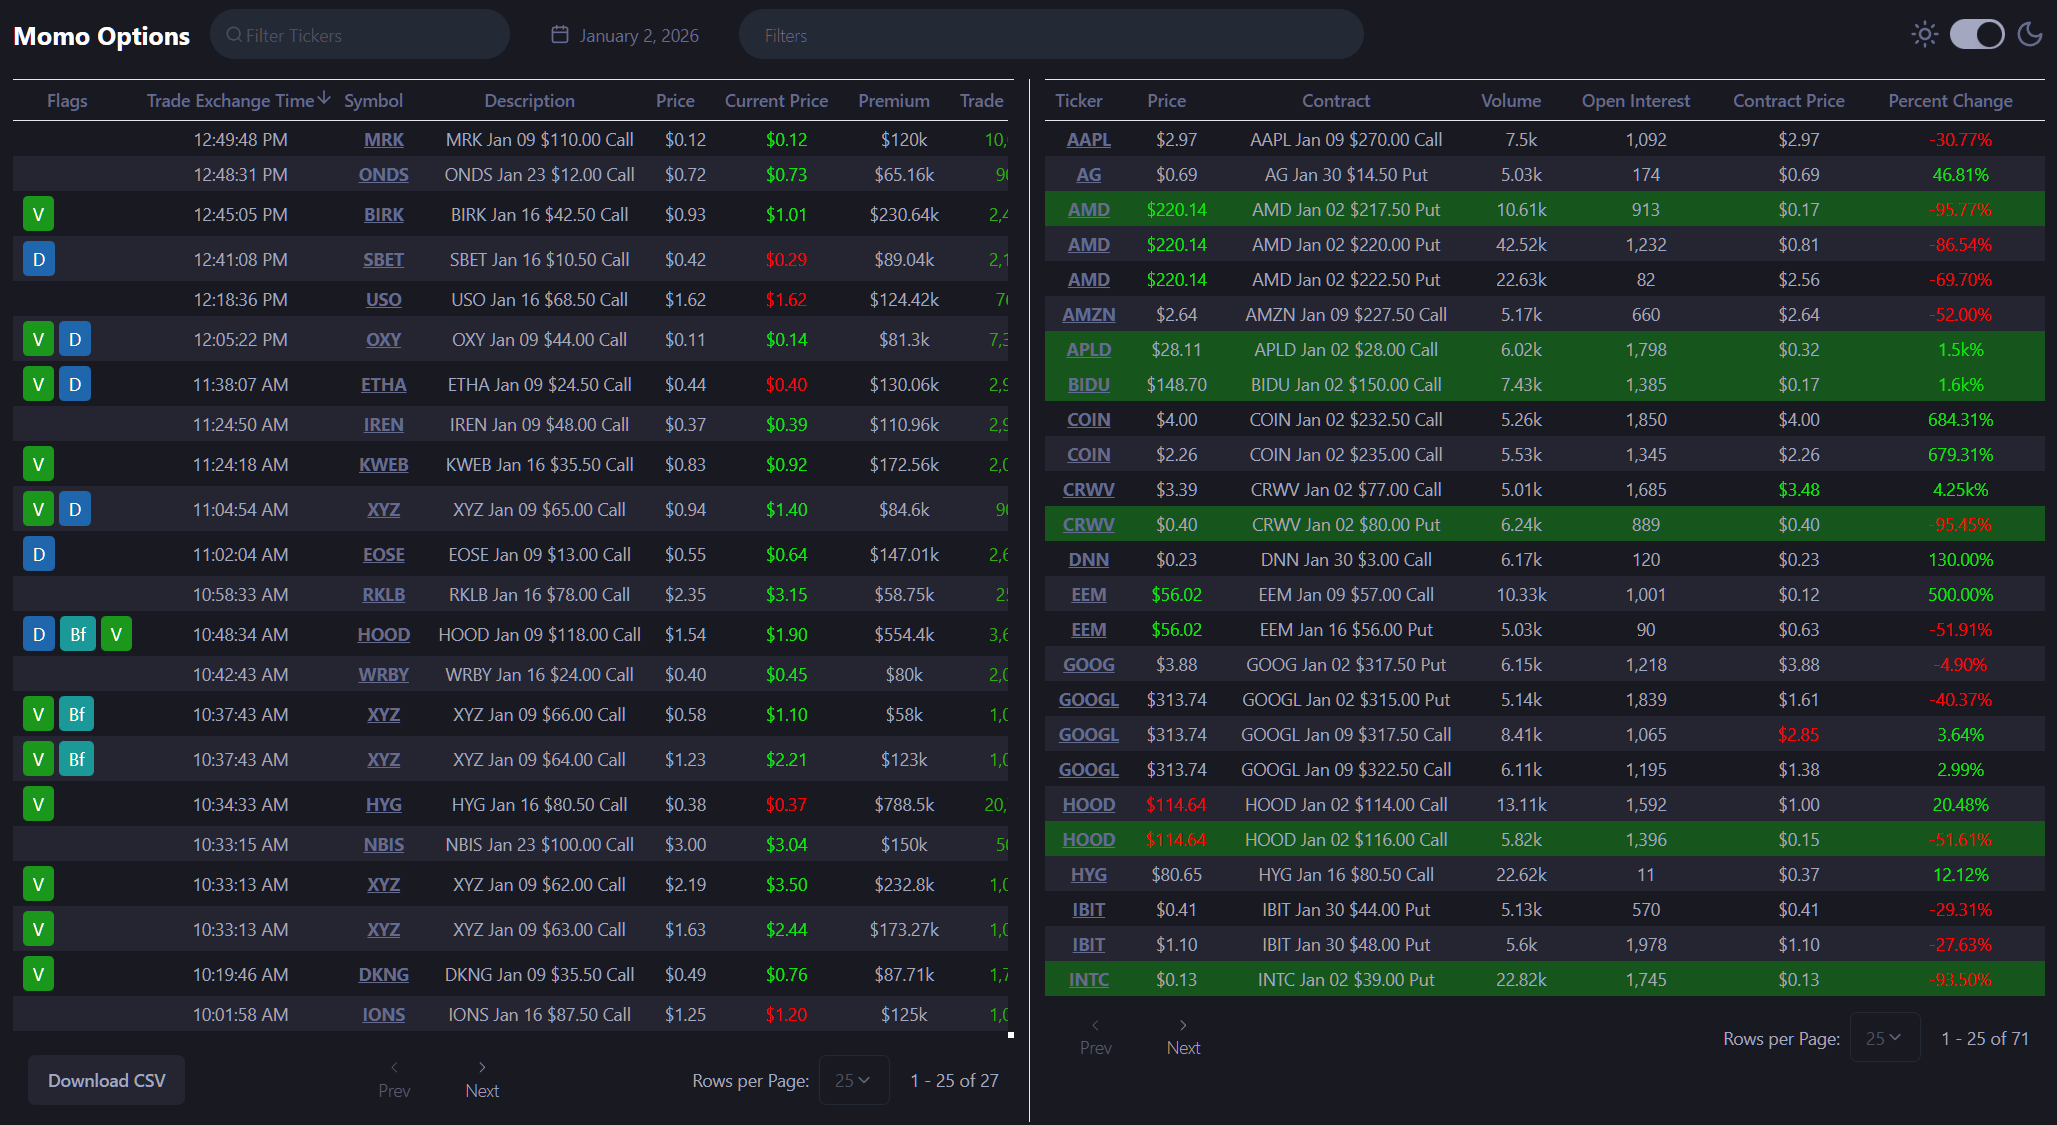
Left Side of the Scanner: Momentum
The left side shows momentum (specifically, where market makers are actively repricing options).
Volatility in the Greeks signals the expectation of a near-term move.
When implied volatility (IV) spikes and delta shifts rapidly, that means market makers are preparing for something big.
These are quick trades, not long holds. You’re not buying and holding for months, but rather one to two weeks.
Focus on the 5-minute chart. The 8-day exponential moving average (EMA) is the most important indicator on these plays.
Here’s the standard momentum setup I look for every single time:
- Price breaks above VWAP
- 8 EMA crosses above 21 EMA
- Price pulls back to VWAP or the 8 EMA
- The 8 EMA must hold
- Targets are predefined
- Stops are tight
When a name like NKE hits the scanner:
- I identify where it triggered
- I find the ideal entry zone
- I determine where risk would be invalidated
If the move doesn’t happen quickly … the setup is broken, and you exit.
Right Side of the Scanner: Pure Options Volume
The right side shows raw, enormous, unusual options volume.
Often these are short-dated contracts, usually slightly out-of-the-money (OTM).
Green highlights indicate short-dated options (higher risk, but potentially explosive moves).
Big size + short-dated + OTM = serious day-trade (or short swing) potential.
But remember: Volume tells you where to look, not what to buy.
Just because there’s massive volume in a contract doesn’t mean you should trade it.
You still need chart confirmation.
Volume informs idea generation. The chart gives you confirmation.
The 4 Questions
Before I enter any trade flagged by the scanner, I answer four questions:
- Where am I wrong?
- What is my risk?
- What is my reward?
- Why does this trade exist?
If I can’t answer all four questions clearly, I don’t take the trade. Period.
The Nike trade worked because I followed this exact process:
- The scanner flagged Nike.
- The chart confirmed the momentum setup.
- The 8 EMA held during the pullback.
- The risk was defined.
- The reward was clear.
I entered ruthlessly, managed the position actively, and exited confidently at my target.
I bagged 100% gains because I had a system that told me exactly what to do at every step.
If you’re sitting there just wishing you could harness that same level of conviction…
You can.
You can use the same scanner, the same setups, and the same process.
Stop guessing (and start crushing)…
Join Options Income Trader Today.
Happy trading,
Ben Sturgill
*Past performance does not indicate future results