
Good morning, traders…
The market’s on fire right now.
We’ve seen the S&P 500 hit fresh all-time highs, the Nasdaq climbing with confidence, and even small caps waking up.
This is a full-blown, risk-on rally powered by AI hype, solid earnings, and hope that the Fed might actually cut rates this fall.
Some traders are calling it the best stretch of the year. Maybe the start of “a new bull market.”
But just because the market is up doesn’t mean it’ll continue running in a straight line. When stocks are ripping like this, most traders fall into one of two traps:
The first? They chase. They see green candles and start firing long without thinking. They buy strength blindly and ignore what the broader structure is telling them. That usually ends with getting caught in a pullback or a fake breakout.
The second trap is worse: they sit out. They see extended charts and think, “This can’t last,” so they stay in cash or try to short strength. And they miss the biggest part of the move because they didn’t know how to read the trend.
Both problems come down to the same issue: a misunderstanding of market structure.
Market structure gives you the context. It tells you what phase we’re in — trending up, trending down, or chopping sideways — and that changes everything. It guides your trade ideas. It helps you time your entries. It shows you whether it’s time to press in or play defense.
You don’t need a crystal ball. You need a clear read of the charts.
Today, I’ll Show You Exactly What Market Structure Is, Why It Matters, And How You Can Use It To Your Advantage…
What is Market Structure?
Market structure is the pattern of highs and lows on a price chart, which creates an overall trend.
It identifies whether the market is trending up, trending down, or moving sideways…
- Uptrends will show higher highs and higher lows.
- Downtrends will show lower highs and lower lows.
- Range-bound consolidation will show the share price moving back and forth between support and resistance.
You should be able to draw clear lines on the daily chart from low to high — or high to low — that form visible trends. If you can’t draw an easily identifiable line on the chart, the trend hasn’t truly formed yet.
Let’s look at the 2024 daily chart of the Invesco QQQ Trust (NASDAQ: QQQ), which tracks the Nasdaq:
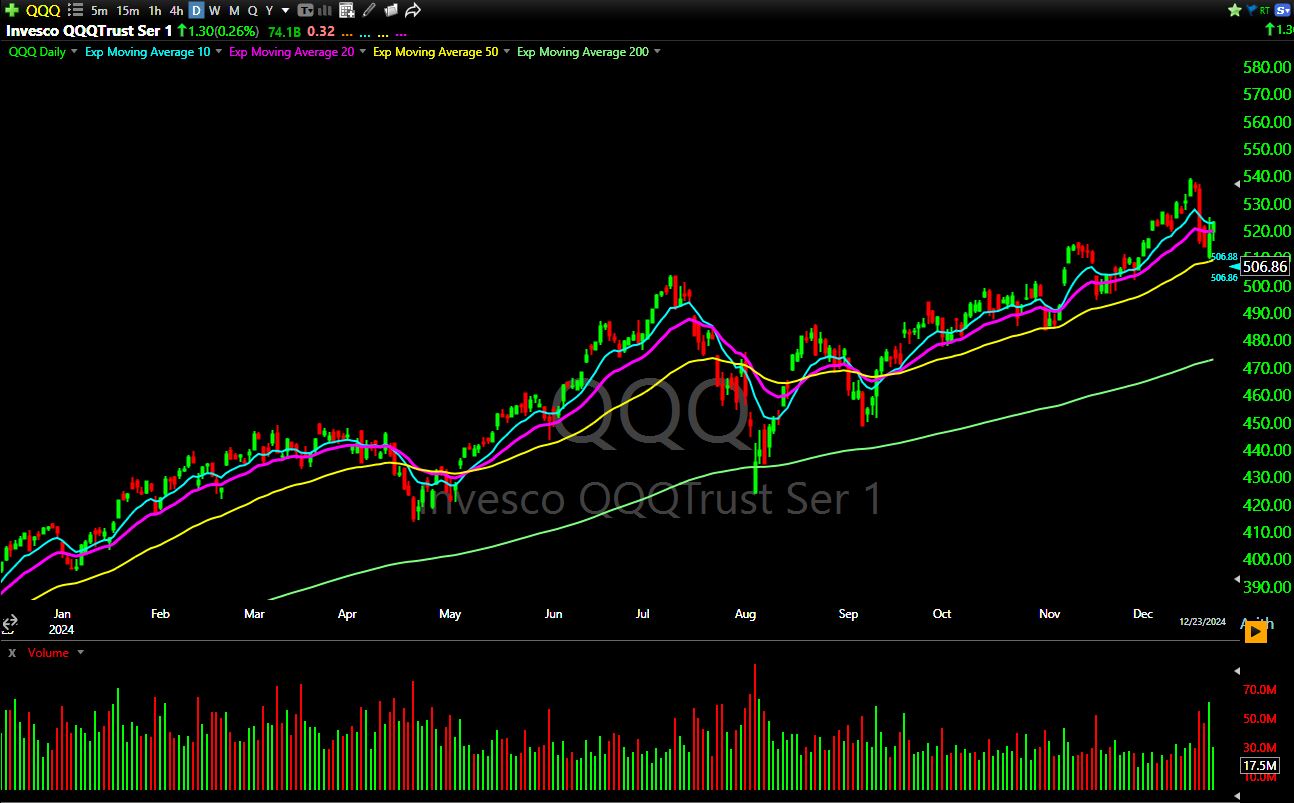
The chart tends to surf the 50-day exponential moving average, creating a clear uptrend…
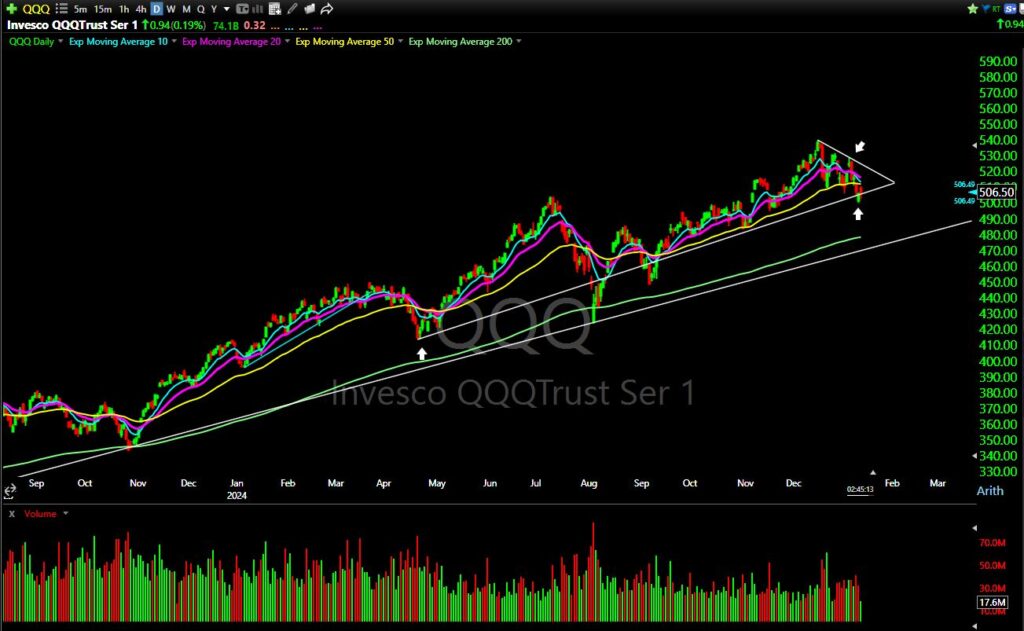
But in late 2024, it started breaking below its 50-day, forming a visible downtrend:
This is where you can use market structure to make (or save) a lot of money — by recognizing major trend reversals.
Had you identified QQQ deteriorating into a downtrend, you would’ve been extra cautious on the long side.
And that would’ve been an excellent decision, as two months later, the index had dropped a staggering 25%:
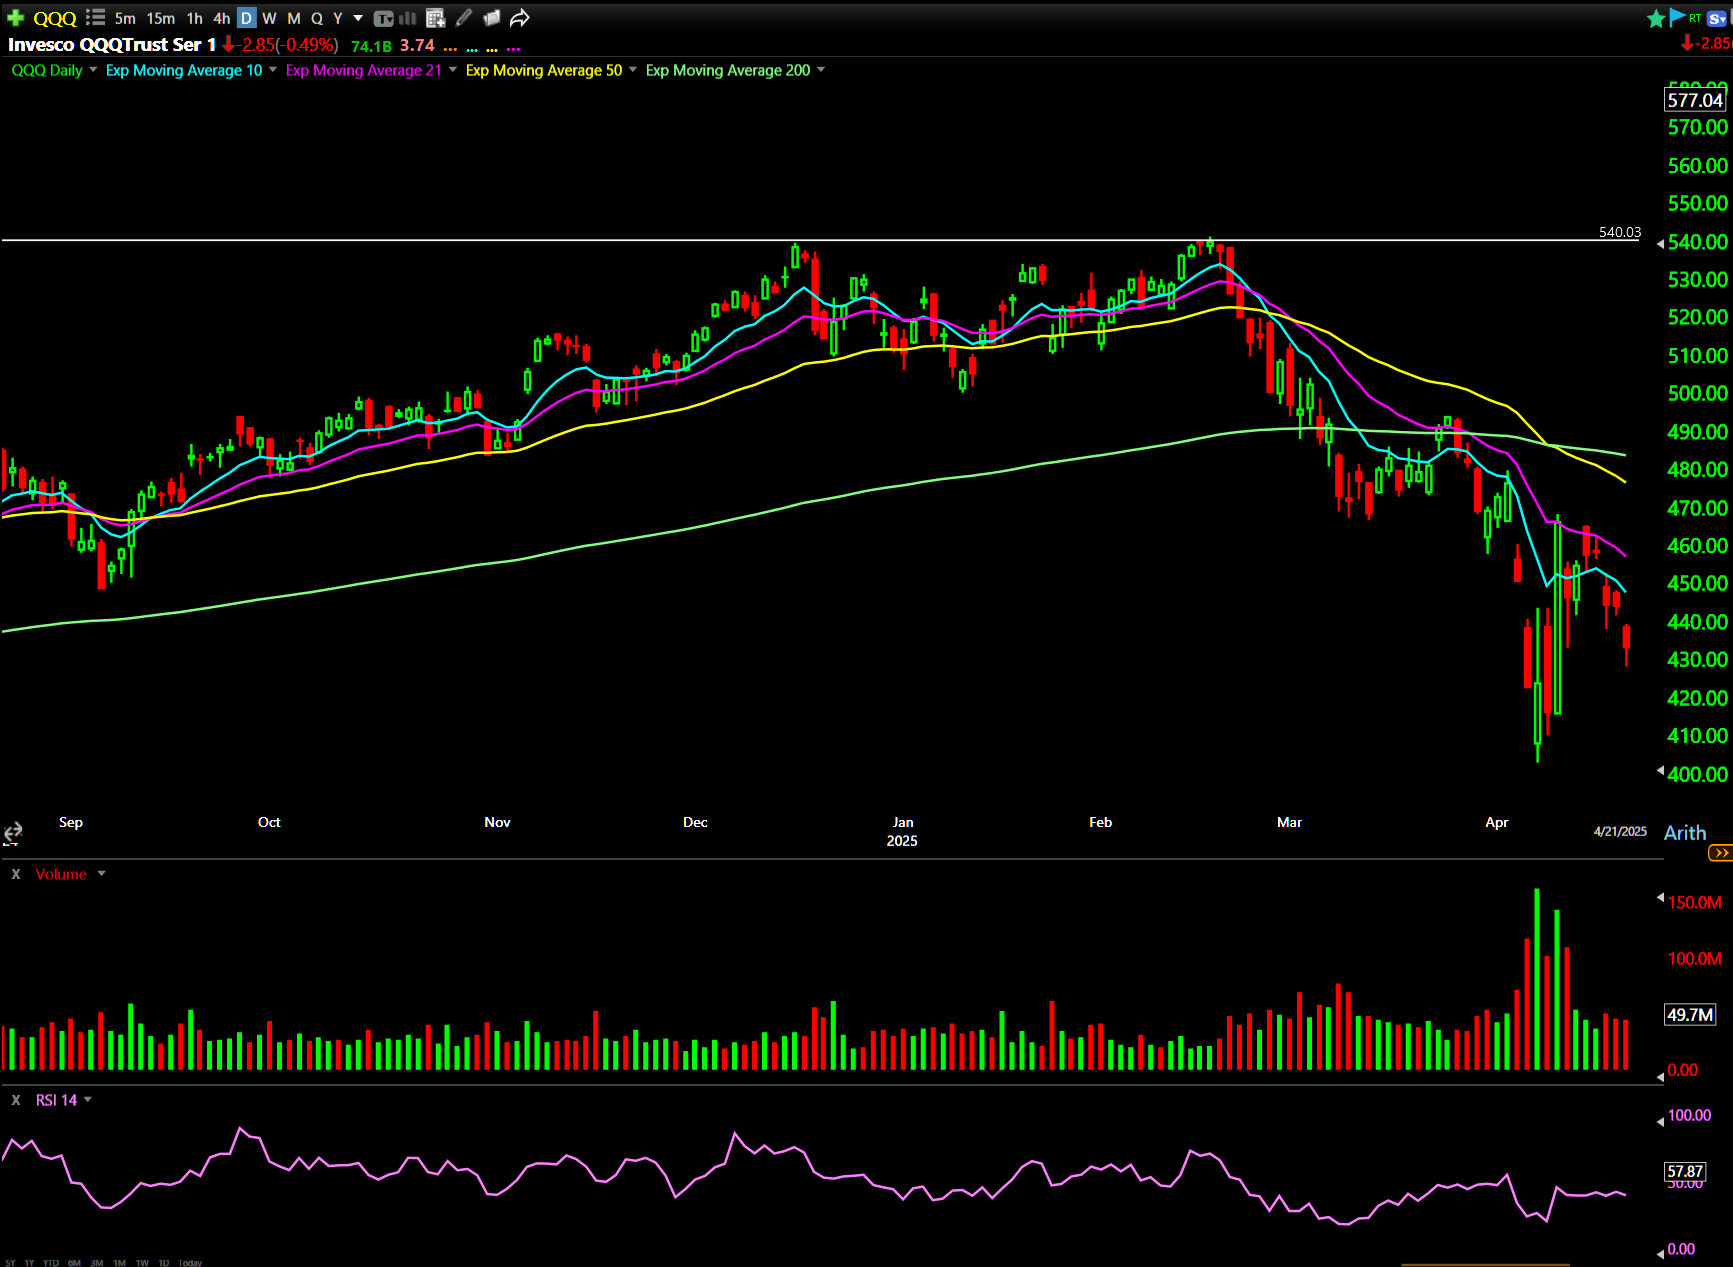
Notice that once the index enters a confirmed downtrend, the same moving average lines that used to act as support now act as resistance.
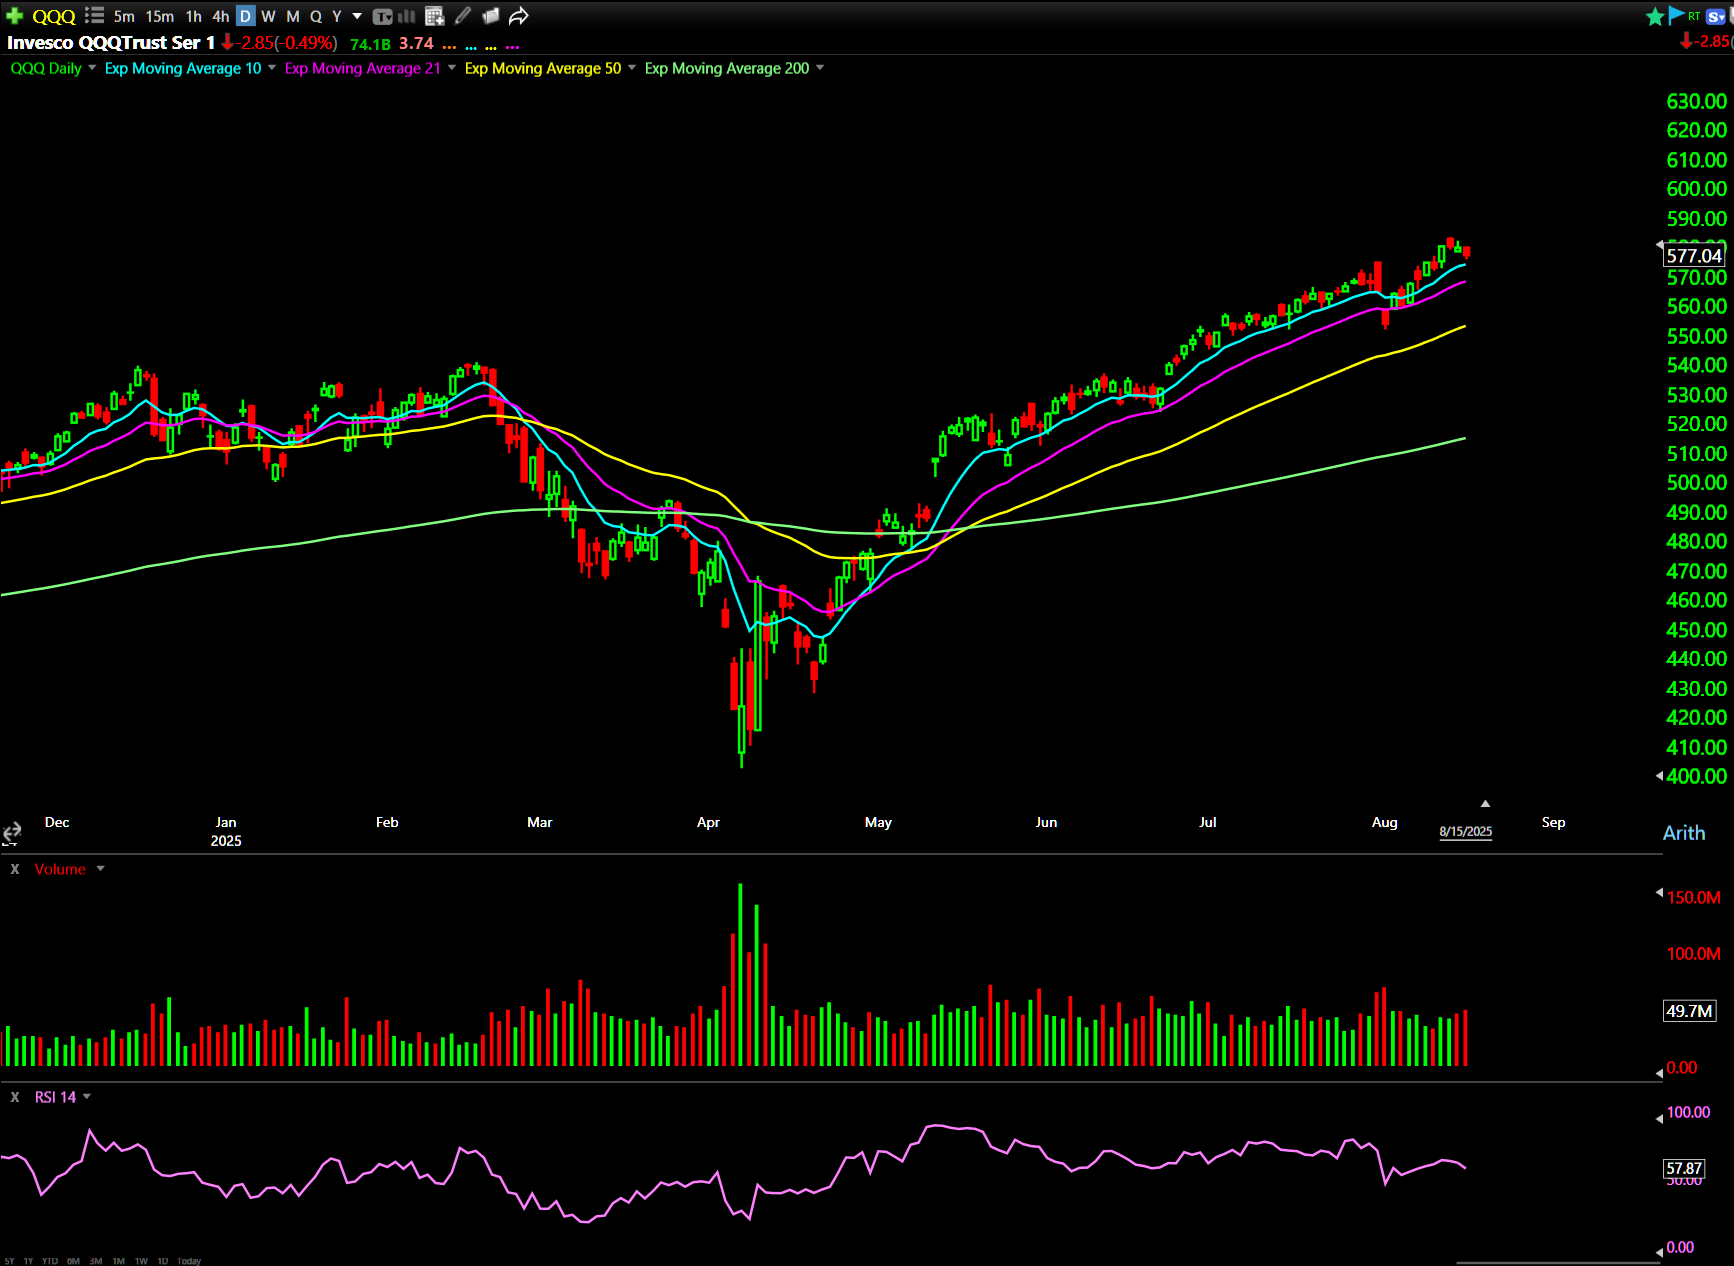
You could’ve used that information to your advantage, knowing that the entire market was bound to explode as soon as the daily chart cracked above those averages.
Sure enough, look what’s happened over the past 10 months:
They say a picture is worth a thousand words. I say charts are worth a lot more than that in dollars.
Why Market Structure Matters
When the overall market is trending higher, it creates tailwinds that help individual stocks rise right along with it.
You can use this to inform how you trade those stocks.
But the opposite is also true. When the market pulls back, even the strongest names can struggle to push higher.
Stocks don’t exist in a vacuum. They’re influenced by broader market trends…
Trying to trade against those trends is like running a treadmill at the highest setting: possible, sure, but exhausting and unnecessary.
That’s why trading with the market structure is so important.
When you align your trades with the overall direction, you’re not just relying on the strength of a single stock — you’re leveraging the market’s momentum to make your job easier.
Here are three more reasons to pay attention to market structure:
- Watching how highs and lows evolve can show you who’s controlling momentum (buyers or sellers).
- In the middle of market noise, structure gives you something clear to focus on, simplifying the big picture.
- You can enter and exit trades at more opportune times by identifying trend continuations (or reversals).
How to Practice It Yourself
Try this…
- Pull up a chart of any stock or ETF and map the recent highs and lows.
- Mark where trends shifted or continued.
- How would recognizing those patterns have shaped your trades?
Markets will always shift between uptrends, downtrends, and ranges.
Traders that consistently beat the market can spot those transitions in real-time — and adjust their decisions accordingly.
And speaking of beating the market…
Are you ready for the $5k Summer Blitz?
Our goal? To make a 400% return on a small account.
$1000 → $5,000 by October 14.
We already 3x’d a small account TWICE using my Earnings Edge system…*
And if we DON’T turn $1,000 into $5,000 by October 14th…
We’re giving everyone who joins our “$5K Blitz Challenge” an exclusive $5,000 value gift…
Completely FREE of charge.
5x or bust.
That’s how confident we are.
Join Danny Phee TONIGHT at 8:00 p.m EST to see exactly how we’ll conquer the challenge.
Happy trading,
Ben Sturgill
*Past performance does not indicate future results