Good morning, traders…
I’m a technical trader. I rely on chart patterns to inform my trading.
I’ve told you about several technical indicators I use on my charts:
200-day simple moving average (SMA) — The average price over 200 days, visualized as a line on the chart.
14-day relative strength index (RSI) — A momentum oscillator measuring speed and change of price movements. RSI reads as a number between 0 and 100. (Usually considered overbought above 70 and oversold below 30.)
Average true range (ATR) — Measures volatility while accounting for gaps in price movement.
Volume profile — The volume traded at various price levels over a specified period.
Each is useful.
But there’s one indicator that trumps them all:
The 21-day exponential moving average (EMA).
This EMA gives you a clear visual representation of a chart’s overall trend. It acts as dynamic support in uptrends and resistance in downtrends.
In other words, it identifies trendlines for you.
And if you learn to use it correctly, you can create an edge that exponentially improves your trading performance.
Let Me Show You Why The 21-Day EMA Is My Favorite Technical Indicator…
Why The 21-Day EMA Works
A huge part of trading is accurately identifying trendlines.
Stocks get stuck in uptrends and downtrends depending on how traders feel about the name.
Whether you’re trading calls or puts, you must know where the trendline is.
Some traders draw their own trendlines on charts.
But over the years, I’ve discovered that the 21-day EMA does most of that work for you.
By paying attention to the 21-day EMA, you can take the guesswork out of identifying your uptrends and downtrends.
Look at SoFi Technologies Inc. (NASDAQ: SOFI):
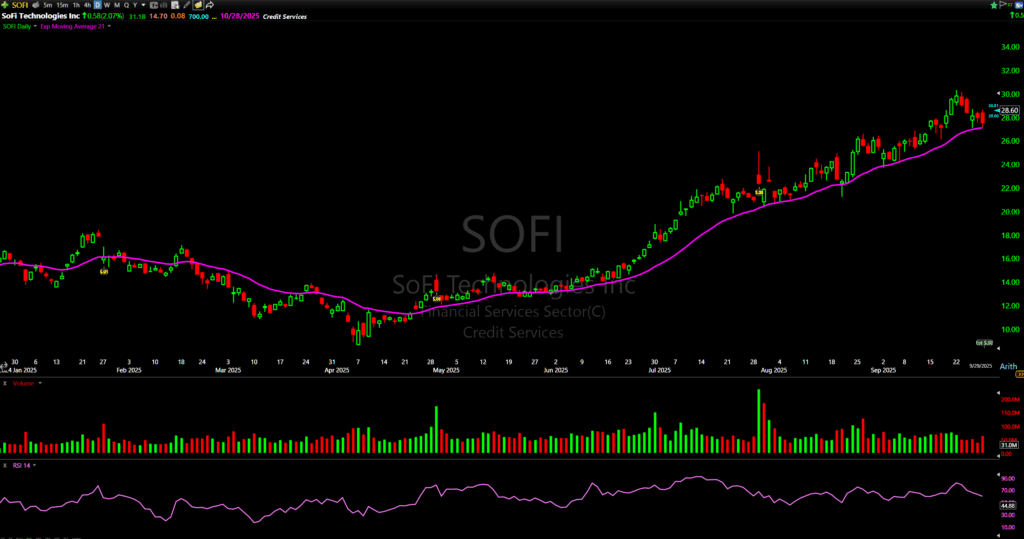
In March and April, the 21-day EMA was resistance.
But as soon as the chart broke above the EMA on heavy volume (and stayed above it), that confirmed the uptrend.
Same thing on the Hewlett Packard Enterprise Co. (NYSE: HPE):
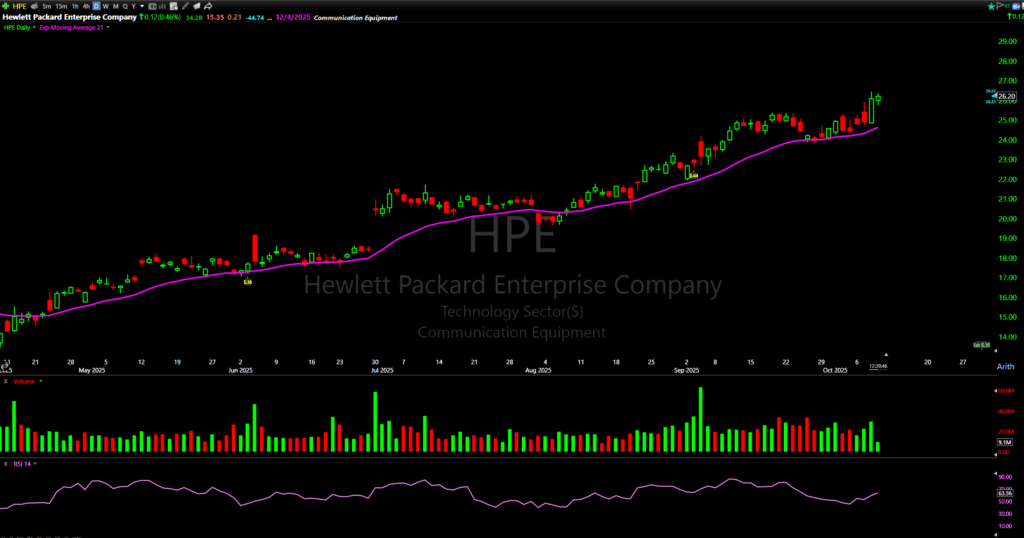
The 21-day EMA is a perfect indicator of the general uptrend.
How I Use The 21-Day EMA
Identify the trend — If the price is above the 21-day EMA and the EMA is sloping up, the stock is in an uptrend. Below and sloping down? Downtrend.
Wait for the pullback — In an uptrend, I wait for the price to pull back to the 21-day EMA. That’s where buyers step in. In a downtrend, I wait for the price to rally to it. That’s where sellers show up.
Confirm the bounce — I don’t buy just because the price touches the 21-day EMA. I wait for confirmation. A bullish candle off the EMA. Volume coming in. Price respecting the level.
Set my stop — If I’m long and the price closes below the 21-day EMA, I tighten my stop or exit. Same thing if I’m short and the price closes above it.
6 Steps to Automate EMA Trades in ThinkOrSwim
Here’s how I automate EMA trades (so I don’t have to watch charts all day).
Step 1: Pick your option.
Step 2: Right-click the buy order and choose “Buy Custom.”
Step 3: Use a template. I have one saved called “EMA Pullback Buy.”
Step 4: Edit conditions. Go to Study → Edit / Conditions. Set: Ask ≤ Exponential Moving Average (Close, length = 21) on your chosen timeframe (I use 5 minutes).
Translation: “When the ask price is at or below the 21 EMA, execute the buy.”
Step 5: Save the template for next time.
Step 6: Confirm and send. The order triggers automatically when the condition is met.
Done. You’ve automated your entry at the 21-day EMA. No need to sit in front of your screen.
The 21-day EMA shows you where recent buyers or sellers are positioned.
In an uptrend, buyers who got in near the 21-day EMA are profitable.

When the price pulls back, they defend it. New buyers see support and step in.
In a downtrend, sellers who got in near the 21-day EMA are profitable.
When the price rallies, they add to their position.
It’s like a self-fulfilling prophecy.
Add it to your charts. Watch how price interacts with it. Automate your entries so you don’t miss high-probability setups.
And speaking of high-probability setups…
After watching five professional wealth managers destroy his portfolio during the COVID crash, my colleague Mr. Anderson decided to stop guessing and start “Trusting The Math.”
He brought his findings to me, and we built the Earnings Edge system…
And the results speak for themselves…
Mr. Anderson recently grew a small account from $3,000 to $32,000 in 52 days by “Trusting The Math” … despite 8 brutal market selloffs.*
And YOU can learn to nail similar results.
All you need to do? Follow the alerts, manage your risk, and execute when the probability is in your favor.
That’s how you turn this season from a sketchy gamble into your very own Earnings Edge.
TONIGHT at 7:00 p.m., Mr. Anderson is sharing his NEXT CALCULATED EARNINGS MOVE FOR FREE…
Save Your Seat For Tonight’s Briefing BEFORE THEY RUN OUT.
Happy trading,
Ben Sturgill
*Past performance does not indicate future results