Happy Friday, traders…
Options trading is full of moving parts, but one of the most important (and often overlooked) skills is knowing how to read an options chain:
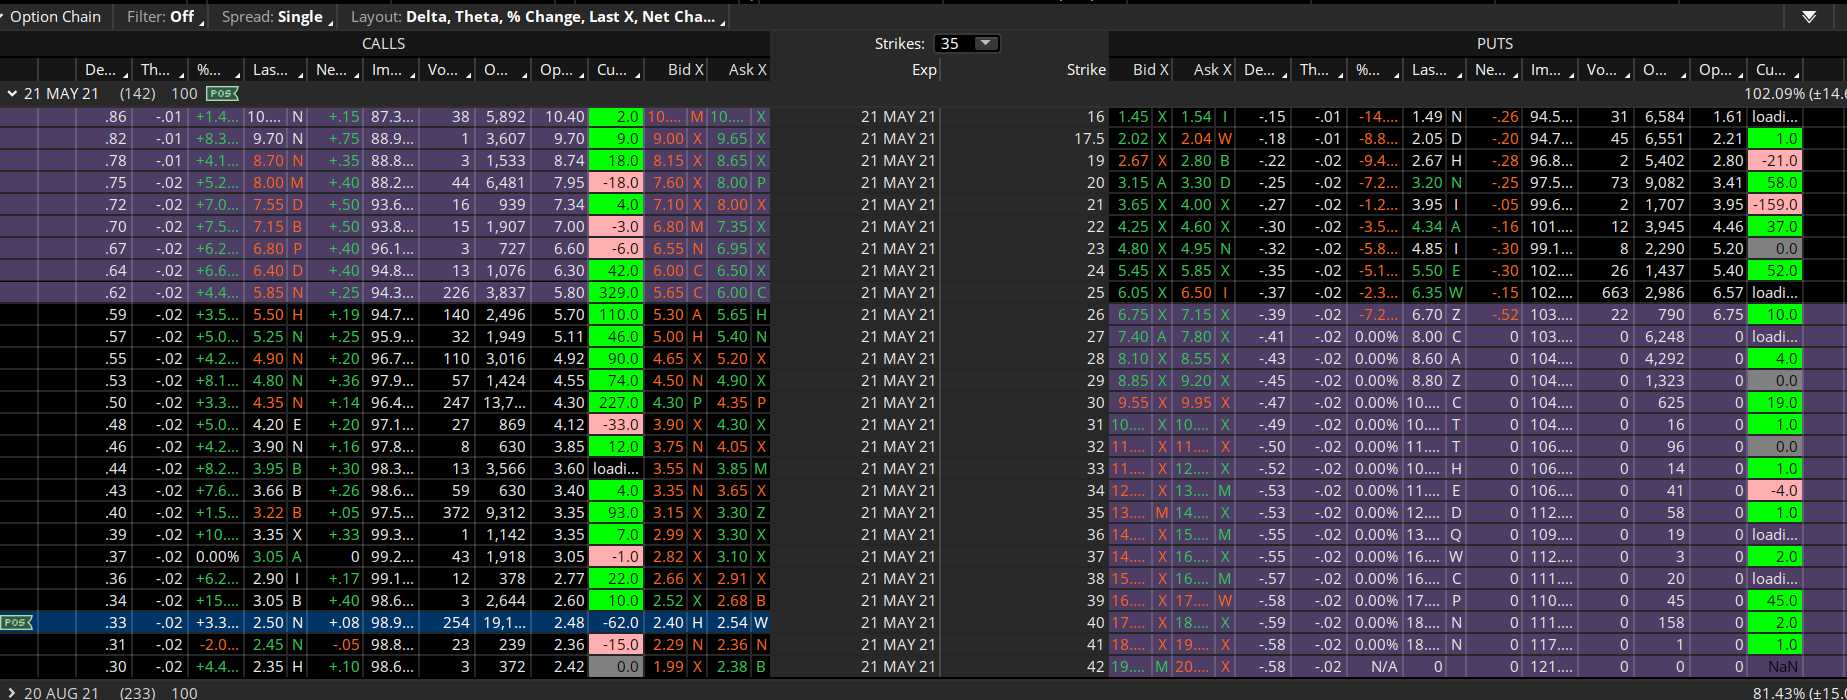
An options chain is the list of available contracts for a specific stock, showing their strike prices, expiration dates, premiums, and key metrics like volume and open interest.
It’s sort of like a restaurant menu for options prices — complete with clues about sentiment, liquidity, and big institutional moves.
It’s the first thing you see when selecting a contract, yet plenty of traders rush through it without fully understanding what they’re looking at.
I always start my day by looking at the OMEN Scanner. But if I see an intriguing bet there, I’ll go look at the options chain for confirmation.
Reading the chain gives me further insight into which strikes have the most activity, where Smart Money is placing bets, and whether a contract is priced fairly.
You wouldn’t order from a restaurant without reading the menu first, right? The same goes for options trading — so let me show you how to read an options chain…
The 7 Key Columns on an Options Chain
Let’s break down the seven most important columns on an options chain (and what you can learn from them):
1. Strike Price
The relationship between a strike price and the share price determines whether an option is:
- In-the-money (ITM): Calls with strike prices below the stock price and puts with strike prices above it. These have intrinsic value.
- At-the-money (ATM): Strikes closest to the stock’s current price. These often have the highest implied volatility and time value.
- Out-of-the-money (OTM): Calls with strike prices above and puts with strike prices below the stock price. These have no intrinsic value and move purely on speculation.
2. Bid and Ask Prices
Every option has a bid price (what buyers are willing to pay) and an ask price (what sellers are willing to accept).
The difference between the two is the bid-ask spread, which matters because:
- Tighter spreads mean better liquidity and easier trade execution.
- Wider spreads indicate lower liquidity and can lead to slippage (paying more to get in or out of a trade).
- If a stock has low-volume options, the spread can be massive, making it tough to trade profitably.
3. Last Price
This shows the most recent trade price for that contract. It can be useful, but traders shouldn’t rely on it too much — the bid-ask spread is more relevant for execution.
4. Volume
Volume shows how many contracts have been traded that day. High volume often means strong interest in a strike price, which can signal where traders are positioning.
This is the basis of my entire OMEN Trading strategy.
- A high-volume call strike could indicate bullish sentiment.
- A high-volume put strike might suggest bearish positioning or hedging.
- Low-volume strikes tend to have wider bid-ask spreads, making them harder to trade.
5. Open Interest (OI)
Open interest represents the total number of outstanding contracts that haven’t been closed out. It gives a broader view of where traders are placing bets.
- High open interest suggests strong mid-to-long-term positioning at that strike.
- Increasing OI combined with high volume could indicate fresh buying activity.
- If OI is dropping, contracts are being closed or rolled into other strikes.
6. Implied Volatility (IV)
Implied volatility tells you how much the market expects the stock to move before expiration. Higher IV means more expensive options and greater potential price swings.
- Rising IV: Options are getting pricier, often due to upcoming events (earnings, news).
- Falling IV: Options are getting cheaper, typically after a big event has passed.
Understanding IV helps traders avoid overpaying for contracts. Buying options when IV is sky-high often leads to “Volatility Crush” after a certain event passes.
7. The Greeks: Delta, Theta, Vega, Gamma
The options chain also includes The Greeks, which measure how an option’s price moves — and show you the probability of a contract’s success:
- Delta – Measures how much the option’s price moves in relation to the stock price.
- A 0.50 Delta call means the option gains or loses $0.50 per $1 move in the stock.
- Theta – Measures time decay.
- If Theta is -0.05, the option loses $0.05 per day as expiration approaches.
- Vega – Measures sensitivity to implied volatility changes.
- If Vega is 0.10, the option gains or loses $0.10 per 1% IV change.
- Gamma – Measures how much Delta changes as the stock moves.
- Higher Gamma means Delta shifts more aggressively, leading to bigger price swings.
How Reading Options Chains Can Improve Your Trading
A well-read options chain helps traders spot where Smart Money is positioned, identify liquidity traps, and avoid overpaying for contracts.
Here’s how:
- Look for high volume and open interest strikes – These tend to have tighter spreads and better trade execution.
- Compare IV across different expirations – If one expiration is unusually expensive, traders might be anticipating a big move.
- Use Delta to gauge probability – A 0.30 Delta option has roughly a 30% chance of expiring ITM.
- Watch how OI changes over time – Rising OI at specific strikes could indicate institutional positioning.
Most traders glance at these seven columns without realizing how much information they provide.
Liquidity, market sentiment, and volatility expectations are all hidden in plain sight.
Mastering the options chain doesn’t just help with picking contracts — it helps with understanding what’s happening under the surface.
The more you understand what the options trade is telling you, the better your results will be.
Before we go, let’s look at:
💰The Biggest Smart Money Bets of the Day💰
- $3.1 million bullish bet on KWEB 04/17/2025 $37 calls @ $1.29 avg. (seen on 3/20)
- $2 million bullish bet on BE 07/18/2025 $25 calls @ $5.10 avg. (seen on 3/20)
- $1.35 million bullish bet on NVDA 03/28/2025 $124 calls @ $1.45 avg. (seen on 3/20)
P.S. Since launching my first scanner 19 months ago, I’ve achieved an 89% win rate with a 72% average gain.*
My top 120 trades have all generated 100% or higher. 27 have soared above 200%, and 12 have exploded beyond 300%.*
And just last week, I released a massive new upgrade to my system that could change everything.
Join the great Danny Phee This SATURDAY, March 22 at 12:00 p.m. EST for a LIVE WORKSHOP where he’ll break down everything you need to know about our brand-new OMEN system.
Let the Smart Money do the hard part for you — Click here to reserve your seat!
*Past performance does not indicate future results