Good morning, traders…
Back in February, my friend Evan asked me to go sailing. I’m not a great sailor, but Evan is, so I agreed to join him.
Yet I didn’t really think about the fact that it was the middle of winter…
When we got out on the water, it was freezing — choppy currents, brutal wind, and nothing but whitecaps as far as the eye could see.
What I expected to be a lovely day of sailing turned into a frigid nightmare…
By the time we got back to shore, I was exhausted, drenched, and ready to hibernate.
I sarcastically told Evan, “I’m never going sailing with you again.”
Looking back, the mistake was obvious: We sailed into conditions we should’ve avoided altogether.
And I’m seeing some similar warning signs in the stock market:
- The CBOE Volatility Index (VIX) is showing signs of fear returning to the market. It surged to $19 on Tuesday. As I’m writing this, it’s at $15.66 — above my sub-$15.50 “safe zone.”
If you can identify seasonality in the market, you’ll have an invaluable tool that tells you when to trade (and when to wait).
Fear creates opportunity. But it also adds a layer of difficulty.
Let Me Show You How To Use Seasonality To Identify Winning Setups (And Avoid Annoying Losses)…
How to Identify the “Trading Season”
As traders, we must know when the conditions are ripe for trading, and even more importantly, when they’re warning us to stay away.
When the VIX is below $15.50, it’s like cruising on a calm lake…
Breakouts tend to hold, pullbacks bounce as expected, and the market flows more predictably.
But when the VIX climbs above $15.50, things change…
Fear takes over, rallies get sold, and put-buying skyrockets.
Stocks can make wild swings, levels of support and resistance lose their reliability, and even the best setups can fail.
In these conditions, the same strategies that work in calmer markets can lead to false breakouts, broken pullbacks, and mental frustration…
Using the VIX to Time Your Trades
Just like the seasons dictate whether it’s a good idea to go sailing, the market has its own seasons.
And the VIX is one of the best indicators of the “weather” in the financial markets…
When the VIX is high:
- Expect sharper and more frequent reversals.
- Breakouts are more likely to fail unless confirmed with strong volume.
- Pullbacks often break key levels, continuing lower than expected.
But when the VIX is low:
- Trends tend to hold.
- Support and resistance levels behave more predictably.
- Setups like breakouts and pullbacks become more reliable.
Knowing this (and trading accordingly) can save you a lot of stress (and money).
4 Tips to Adjust Your Approach
Here are four strategic adjustments to consider when the VIX is elevated:
Be Picky with Setups
In calmer markets, you might take trades that look “pretty good.” When the VIX is high, only trade setups that check every box. Strong volume on a breakout? Yes. Clear support on a pullback? Absolutely. Anything less? Pass.
Use Smaller Position Sizes
With increased volatility, the swings can be much larger than usual. By reducing your position size, you can protect your account from excessive drawdowns while still participating in the market.
Use Shorter Timeframes
If you’re comfortable trading shorter timeframes, doing so can help you navigate the choppiness.
Intraday setups often play out smoother because they avoid the overnight risk associated with high volatility.
That said, uncertainty can also lead to opportunities. When an undeniable trade sets up, you must take it.
And speaking of undeniable setups…
President Trump is preparing to announce his boldest economic plan yet … a move to fast-track an unprecedented $9 trillion initiative…
But before it has a chance to become “law of the land…”
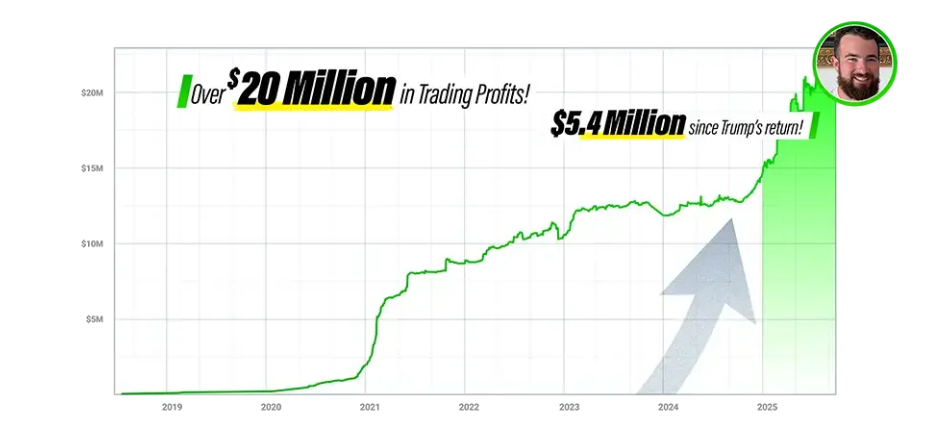
On Wednesday, September 10th at 8 p.m. EST, Tim Sykes is going live with $20 million trader Jack Kellogg…
Since Trump’s return to the White House, Jack’s banked a ridiculous $5.4 million in trading profits.*
Happy trading,
Ben Sturgill
*Past performance does not indicate future results