April showers bring May flowers…
But in early April, we’re already seeing stocks push toward the sun.
Like tulips at the first sign of a springtime thaw, stocks are surging to new 52-week highs right now.

I’ve touched on this topic before: stocks that show bullish momentum outside the energy crisis from the war in Iran.
As both sides grow more desperate to de-escalate (amid high energy costs and literal destruction), the market starts to hope…
And when the market regains hope, we immediately see it reflected in the price action.
The stock I’m watching right now is proof…
The Importance of New 52-Week Highs
Traders see a stock spiking to new 52-week highs, and they think: I’m too late. It’s too risky and too overextended.
That knee-jerk reaction costs them money.
Stocks grind to new 52-week highs because buyers are in control.
But the real move isn’t the first push to that level…
It’s what happens after.
When a stock tags a new high and then consolidates beneath that level for days, weeks, or even months, it’s building potential energy.
Every day that it refuses to break down is another day the weak hands exit, and the strong hands accumulate.
When the breakout finally comes, it’s usually a strong move because it’s making new 52-week highs…
Odds are low that anyone’s holding shares above the current price level. There’s blue sky ahead.
This is one of the most reliable patterns in the market. And it’s one of the easiest for newer traders to spot.
You’re about to see why…
The Top Breakout Right Now
On April 1, Marvell Technology Inc. (NASDAQ: MRVL) pushed to new 52-week highs.
On March 31, just a day earlier, the market learned that NVIDIA Corporation (NASDAQ: NVDA) invested $2 billion in MRVL technology for a partnership to connect MRVL to the Nvidia AI factory and AI-RAN ecosystem through Nvidia NVLink Fusion.
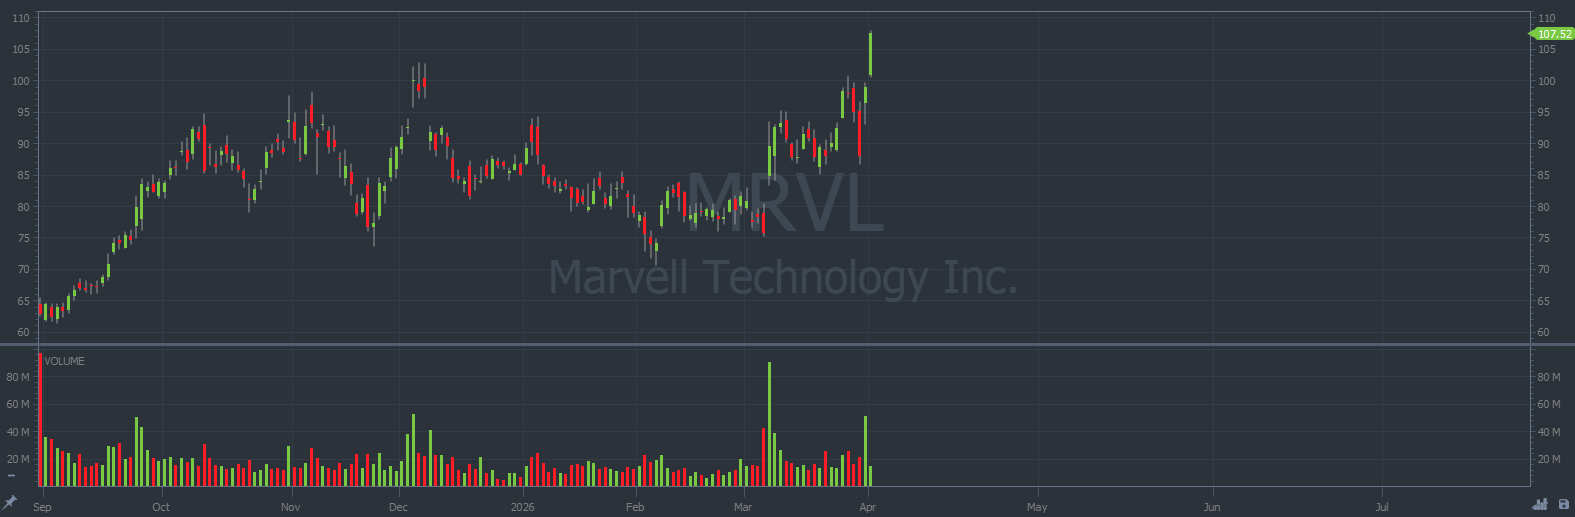
Notice how the stock surged past the highs from December 2025. That’s the pattern!
Right now, I’m looking at April 10 $107 Calls. The contracts had a volume of 7,000+ on April 1.
This strength is not random.
- There’s a catalyst.
- The chart matches our breakout pattern.
- The trading volume confirms the strength.
All that’s left is to trade it…
Pay attention to key intraday levels on the chart:
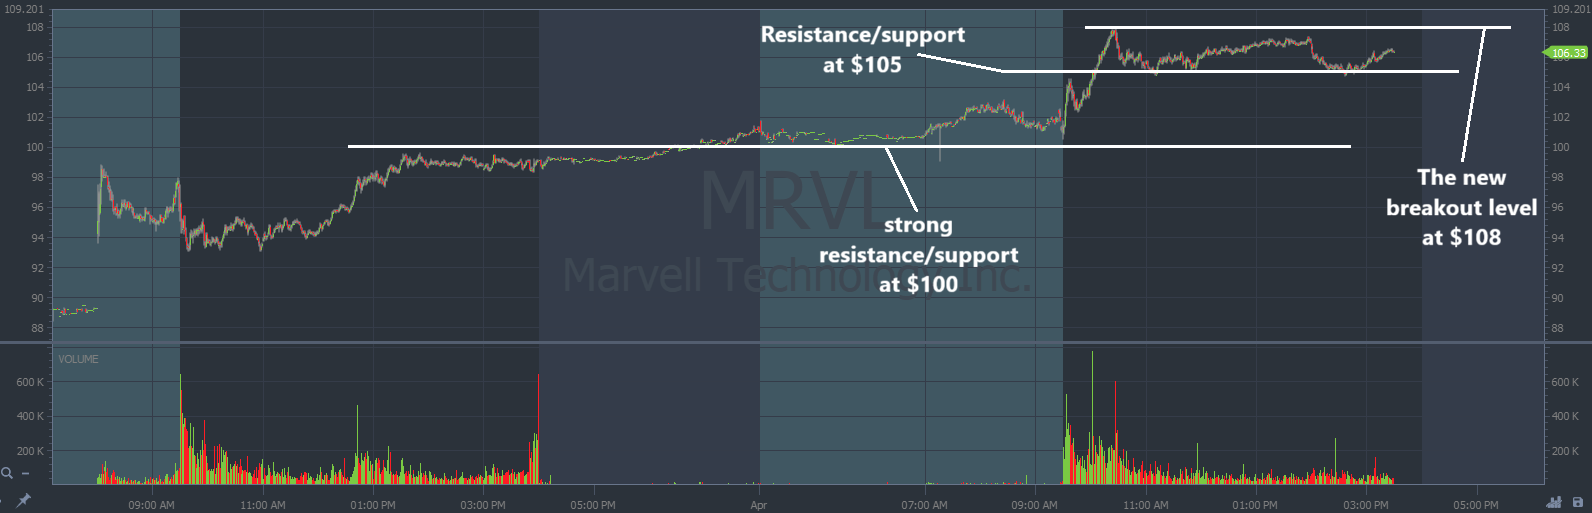
A smart position allows traders to bank on this volatility without risking their account.
Pay attention to the price action. And if the war in Iran subsides, we can expect even more stocks to push toward the sun.
Be good (and be good to others),
Ben Sturgill
*Past performance does not indicate future results. Not typical.