Good morning, traders…
I can’t predict the future. No one can. There are no crystal balls made specifically for traders.
But I can tell you the exact moment when a stock is setting up for a bullish reversal.
I’ve watched this sequence play out hundreds of times. The same signals. The same patterns.
And when they all align, the probability of a sustained move higher increases dramatically.
There’s a specific convergence of Smart Money positioning, price action, and volume that happens right before a stock starts climbing.
If you know what to look for, you can position yourself before the move happens instead of chasing it after it’s already gone.
This pattern works on any timeframe. I use it on daily charts for swing trades and on 5-minute charts for day trades.
The signals stay the same whether you’re holding for days or hours.
This matters right now because the market is choppy. Gaps down, gaps down. Stocks that got hammered on Friday are showing reversal signals this week.
You can’t wait until the stock is already up 10% off the lows, already breaking out, already on everyone’s radar.
By then, you’re late.
I enter when Smart Money is quietly positioning and the chart is showing me the first signs of exhaustion.
Before every trading forum starts talking it up and the move becomes obvious.
Let’s Break Down The 4 “Reversal Clues” I Watch For (And Why They Work)…
Clue #1: Smart Money Flow
Before I even look at a chart, I check my OMEN Scanner.
Smart Money flow puts a stock on my radar.
When I see large call orders coming in on a stock that’s been selling off, that tells me Smart Money sees something.
They’re accumulating while retail is still deciding whether they should enter.
That’s when I pull up the chart to see if the technical setup confirms what the options flow suggests…
Clue #2: Technical Exhaustion
Once Smart Money flow shows up on my scanner, I look at the chart for exhaustion.
The stock has been selling off. Maybe for hours, maybe for days. Red candles. Lower lows. Everyone who wanted out has already sold.
Then something shifts.
The selling slows. The candles get smaller. Volume starts to dry up on the down moves. The 14-day relative strength index (RSI) moves below 30.
That’s selling exhaustion.
And when I see Smart Money positioning into exhaustion, I know there’s a strong chance of a big move.
Clue #3: Volume Spike on Green Candles
This is the exact moment I know a reversal is coming.
The stock is sitting near a support level, like a previous resistance turned support, a key moving average, or a round psychological number.
It’s been grinding lower or sideways. Volume is light on the bottom end of the sell-off.
Then one candle prints green with 2x, 3x, or even 5x the average volume.
That tells me buyers are stepping in with conviction. That’s the Smart Money I saw on my scanner earlier, now showing up on the chart.
When I see that green candle with heavy volume near support — and I already know Smart Money is positioning — that’s confirmation.
The reversal begins…
Clue #4: Higher Lows
But one green candle isn’t enough. I need confirmation.
After that initial volume spike, I watch what happens next.
Does the stock pull back? Does it retest the low? Does it break above resistance?
I want to see it hold above the previous low. That’s a higher low.
The stock tests support, buyers show up with volume, it pulls back to retest, and buyers show up again … at an even higher price.
That’s confirmation.
The reversal is now in full swing.
Why This Works
Bullish reversals happen when sellers get exhausted and buyers see an opportunity.
To recap the four clues:
- The Smart Money flow on my scanner tells you institutions are positioning.
- The chart exhaustion tells you sellers are done.
- The volume spike tells you buyers are stepping in with size.
- The higher low tells you they’re committed.
When all four align at a key support level, it’s time to pay attention.
I can’t predict the future.
But I can recognize these four signals, over and over again.
It’s about identifying the clues that most of the market is completely oblivious to … and weaponizing them in your trading.
While most people get crushed trying to compete with Wall Street…
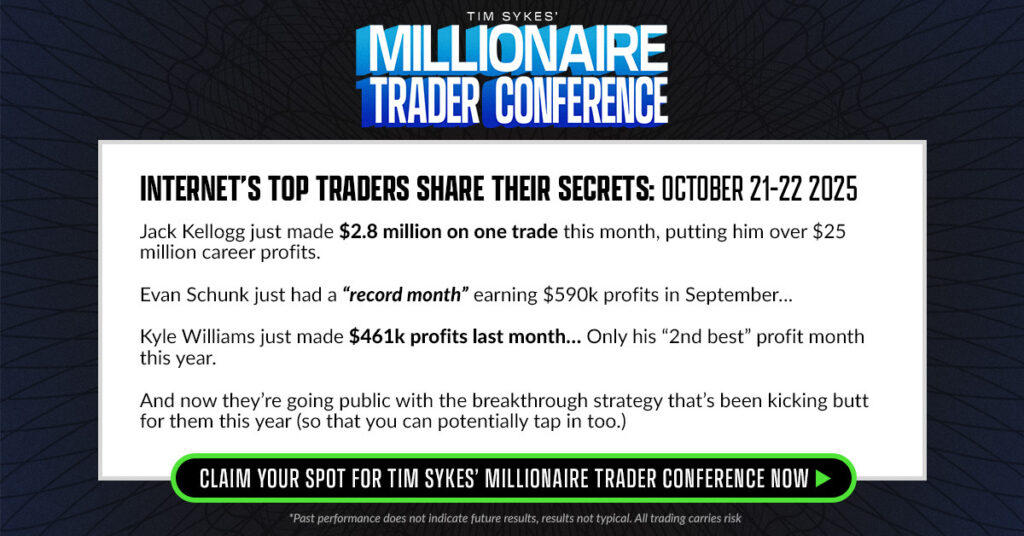
44 traders have used Tim Sykes’ unique formula, trading a hidden corner of the market that gets completely overlooked by mainstream investors.
The same formula that helped Tim turn $12,4000 into $7.9 million in career profits…*
And the same formula that all of these everyday traders used to transform their trading:

On October 21-22, Tim wants to show YOU how his secret trading formula works…
Free tickets are going fast. Register here before they’re gone.
Happy trading,
Ben Sturgill
*Past performance does not indicate future results. Not typical.