Good morning, traders…
Welcome back from Thanksgiving weekend.
I hope you spent time with loved ones, ate a lot of turkey, and enjoyed a break from your screens.
But now it’s time to get back to work.
And the timing couldn’t be better…
The market is staging a bullish reversal following the wildly choppy price action of the past six weeks.
Just look at the 4-day returns on last week’s Smart Money Radar trade ideas:
- CIFR December 19 $13 Calls: $2.80 to $4.30 (56% gain)*
- TJX November 28 $149 Calls: $1 to $3.50 (250% gain)*
- WMT December 5 $106 Calls: $0.50 to $1.93 (200% gain)*
- GOOGL December 5 $300 Calls: $5.50 to $21.00 (281% gain)*
You might’ve missed last week’s wins, but you don’t have to miss this week’s follow-through trades…*
Let me show you exactly what changed, why it matters, and where the biggest opportunities are setting up right now.
You still have time to position for the reversal.
The window’s open. But it won’t stay open long…
The Most Important Chart in the World
The most important chart in the world is FINALLY starting to bounce back…
The SPDR S&P 500 ETF Trust (NYSE: SPY) had a sharp drop over the past month…
Brutal chop made directional trading especially difficult.
But now we’re getting an undeniable V-shaped bounce:
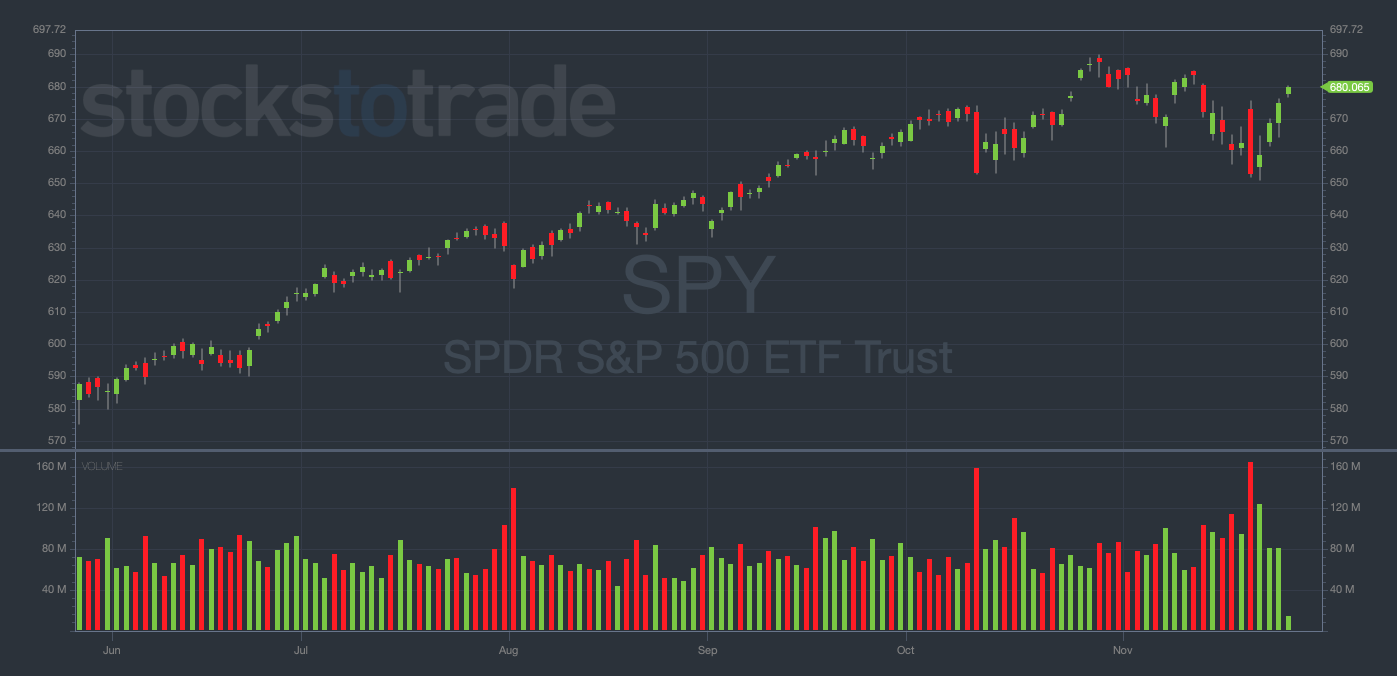
The index is still rangebound between $651 and $691.
It’s not a face-ripping breakout … yet.
But it’s holding above the key level around $675, which previously acted as resistance.
I’m waiting for the moving averages to curl up into an obvious snapback formation.
And the market internals are supporting that theory…
The $TICK broke above 1967 (the mid-Bollinger Band). This is the key level that shifts system rules from caution to conviction.
Now that the $TICK has cleared this level, long call trades have more support.
Economic data adds to the bullish pile. Unemployment claims have dropped, while durable goods orders tripled expectations.
We’re not in a confirmed breakout yet, but stocks are looking much better than they were this time last week.
Where are the absolute best trading opportunities hiding?
These charts stand out above the rest with solid patterns, insane Smart Money flow, and narratives that make sense.
Nike, Inc. (NYSE: NKE)
Contracts To Watch: December $12.67 Calls
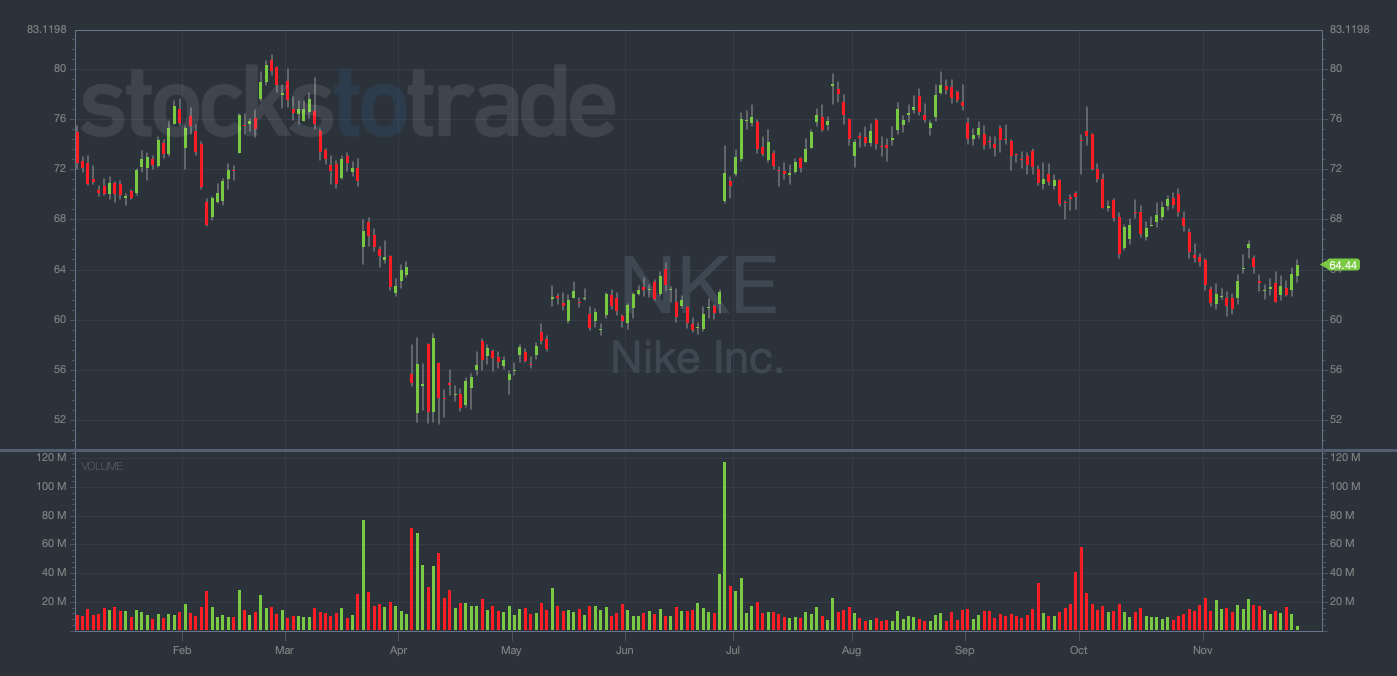
This setup combines ridiculous Smart Money flow with a rapidly improving chart structure.
The chart is forming a higher low with an inverse head and shoulders pattern.
The trigger sits at a break above $64.15.
Calls were bought near the bid in huge amounts, and the longer expiration aligns with current VIX conditions.
AEHR Test Systems (NASDAQ: AEHR)
Contracts To Watch: December 19 $22.50 Calls
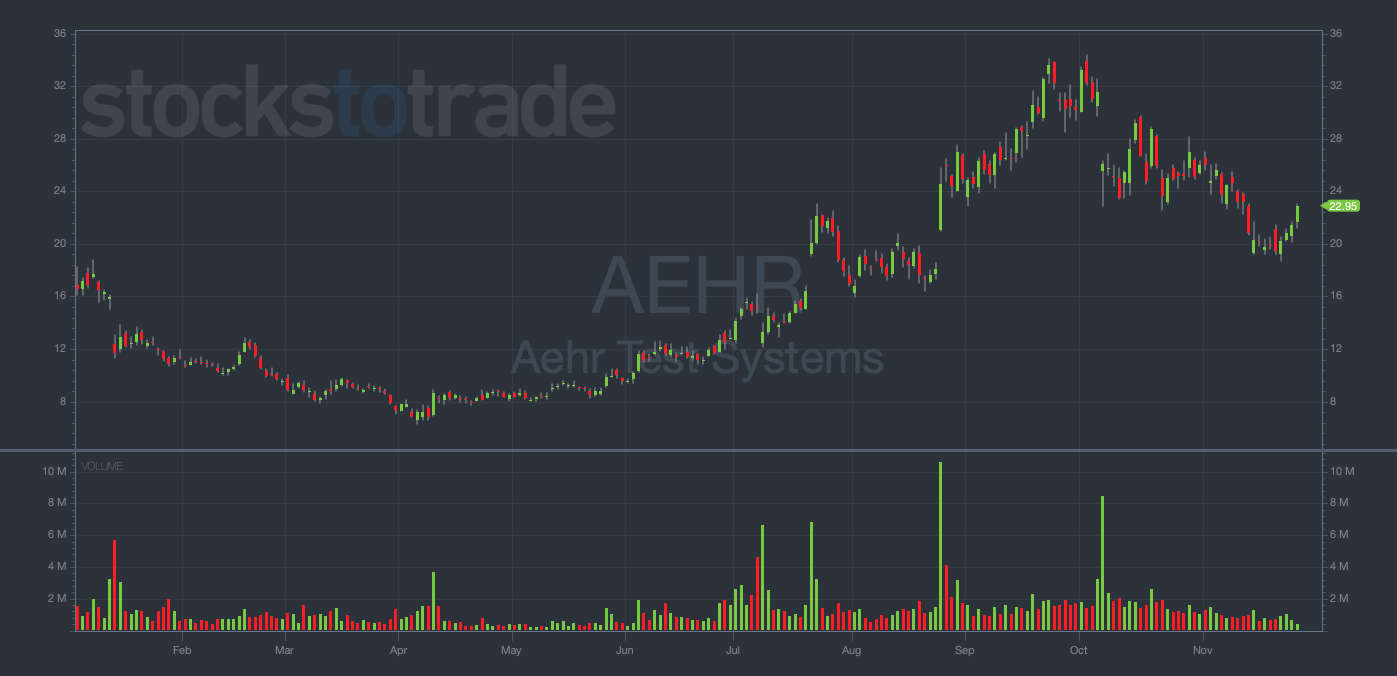
AEHR got hammered with sweeps late in the day.
The trigger sits at a break above $22 (key psychological level).
Target zone: a move toward $23 (former support turned resistance).
Heavy, repeated sweeps suggest aggressive accumulation.
Wingstop Inc. (NASDAQ: WING)
Contracts To Watch: December 19 $315 Calls
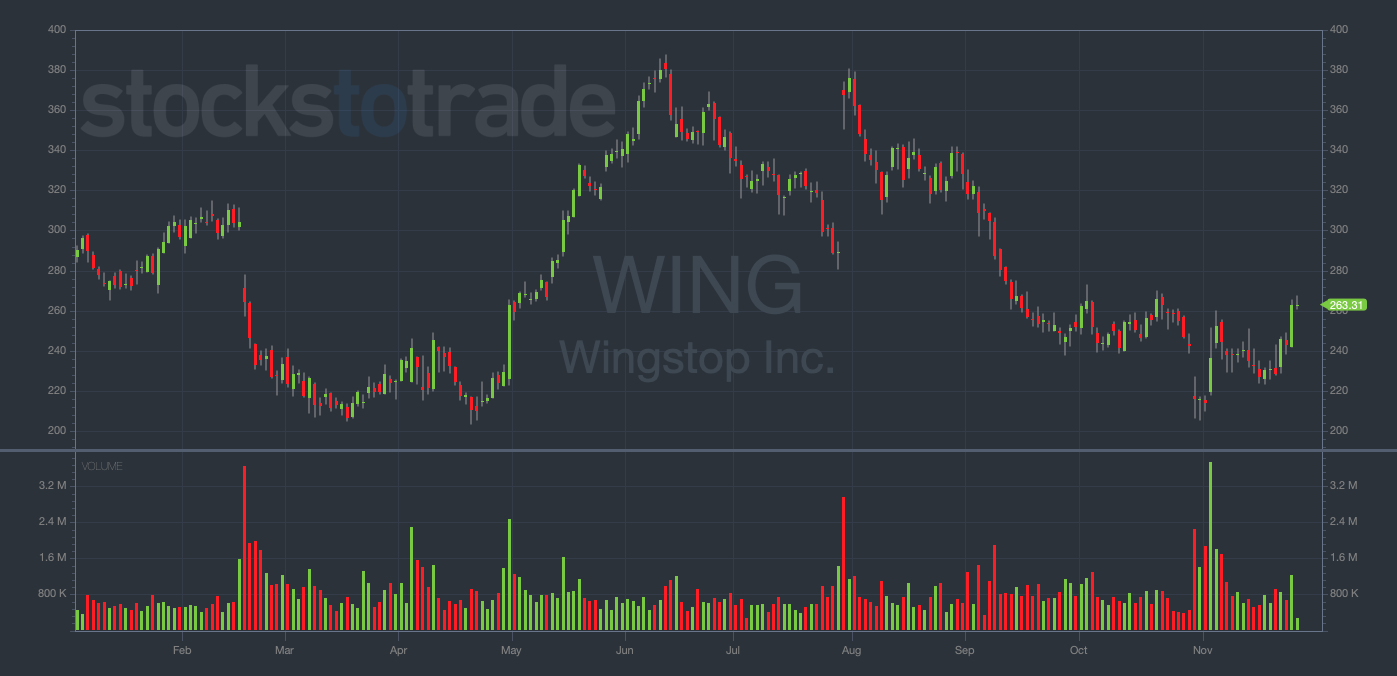
Who doesn’t love chicken wings?
Huge Smart Money bets came through on WING last week with a massive increase in open interest.
The chart shows an “Inverse Head and Shoulders” pattern. The stock is range-bound but setting up for expansion.
The trigger sits at a break above $270 (major resistance).
Target zone: toward $324 (next major resistance).
Zoom Video Communications, Inc. (NASDAQ: ZM)
Contracts To Watch: December 19 $95 Calls
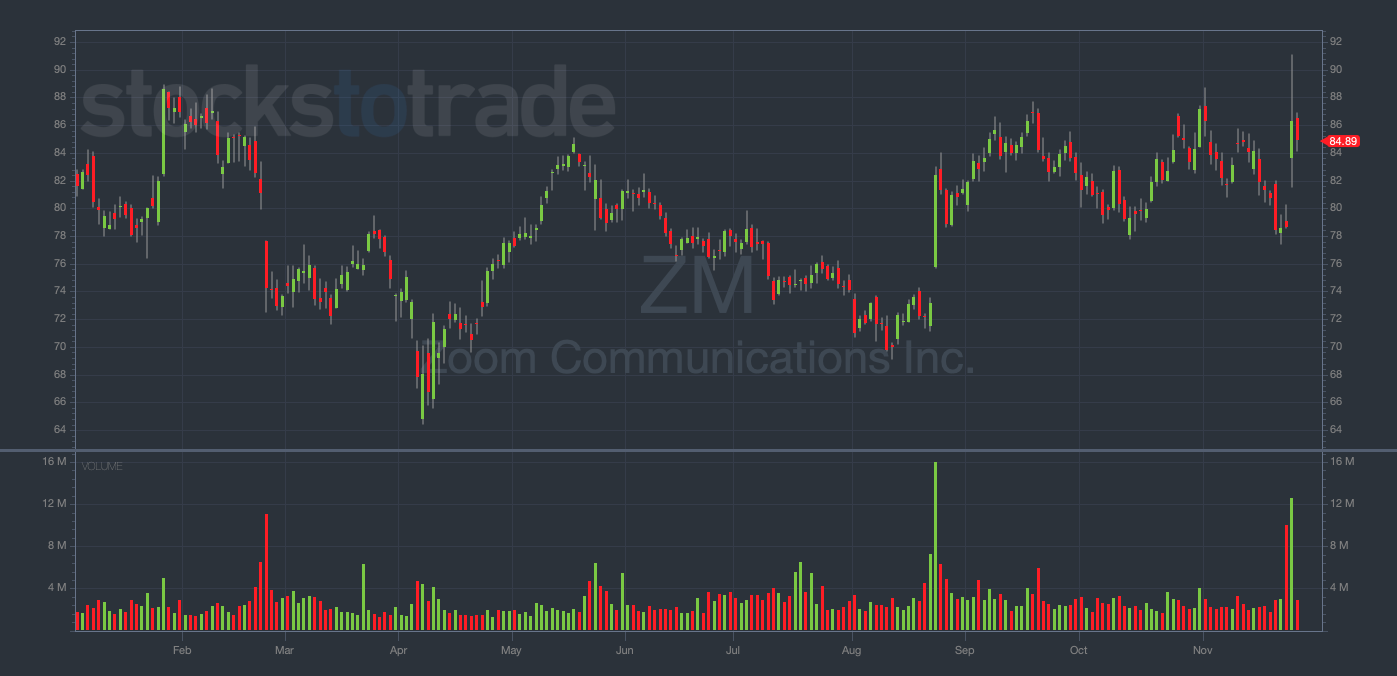
ZM has been on fire post-earnings.
The chart shows a long, wide range. I’m watching for a breakout from congestion.
The trigger sits at a break above $88.50.
Strong late-day call accumulation + post-earnings continuation = high probability setup.
Alphabet Inc. (NASDAQ: GOOGL)
Contracts To Watch: GOOGL November 28 $325 Calls
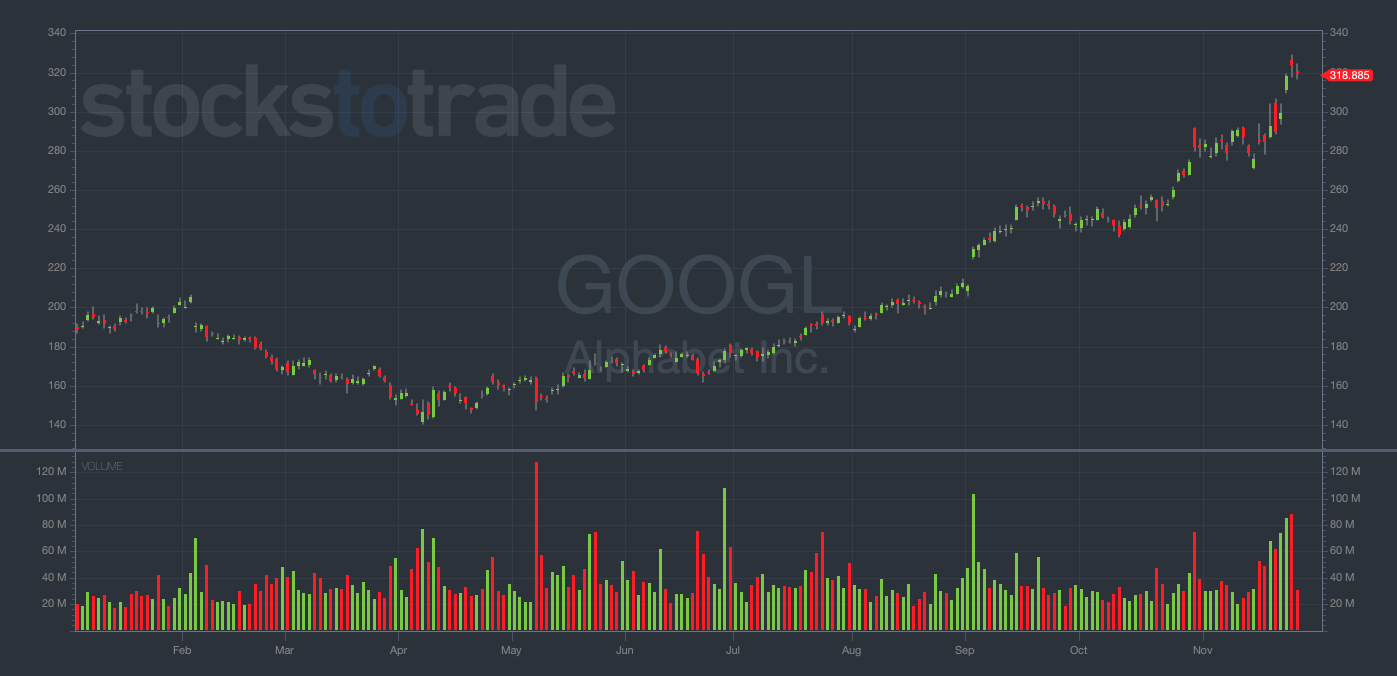
GOOGL is outperforming the entire tech sector.
It held up better than any other Mag 7 name during October and November’s reddest days.
And it’s one of the most beautiful charts in the stock market right now.
Entry Plan #1 (bounce): take a bounce off $318.54 (gap fill) with a stop at $316.50.
Entry Plan #2 (breakout): enter on a break above $320.50.
Set your alerts at the levels I outlined.
Wait for confirmation.
Enter only when the price action proves the setup.
Don’t chase. Let these setups come to you.
Happy trading,
Ben Sturgill
*Past performance does not indicate future results