Yesterday, I alerted a trade that returned 200% gains.
It was on a famous stock that everyone knows, with a pattern that repeats in the market…
There’s one indicator that tells me when to buy.
I always shake my head when Twitter traders have 15 different indicators on their charts. How do you see in that mess?

The best trade patterns are simple.
There’s less to look at, there’s a shorter checklist, and it’s easier on our mortal brains.
Everyone says, “work smarter, not harder.” A lot of traders are working too hard.
Let’s change that…
Apple Inc. (NASDAQ: AAPL)
On Wednesday, August 19, AAPL started to spike after a double bounce off of $300 support.
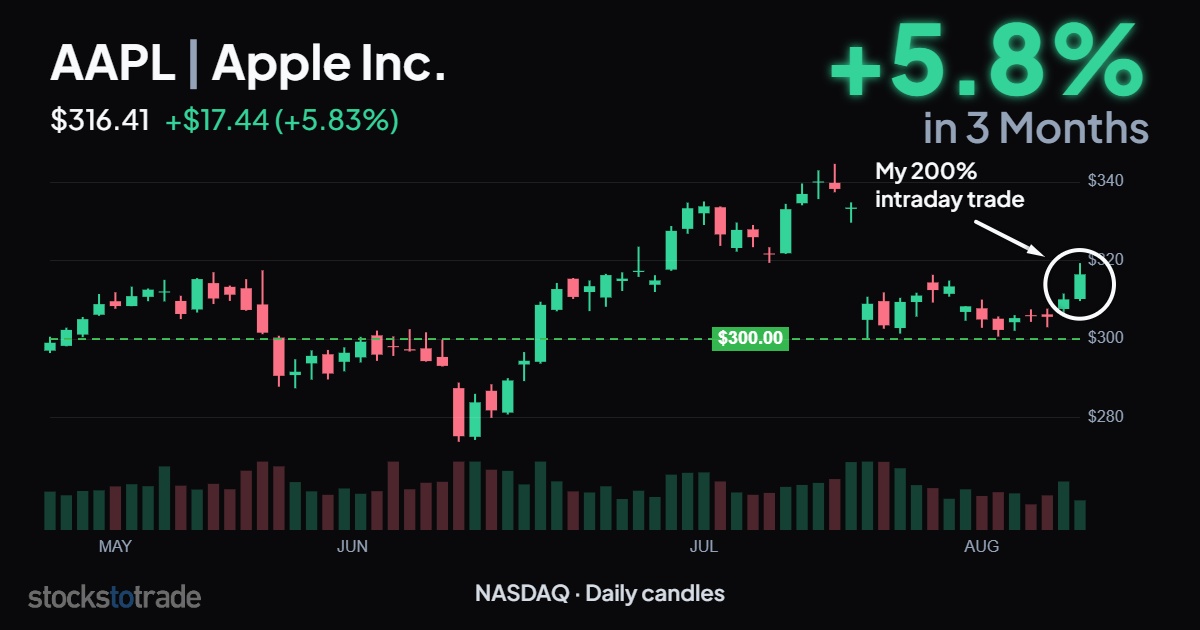
I was immediately interested in the move, especially because there was a massive gap to fill on the monthly chart.
But it’s not enough to find a strong stock. We have to plan our entry carefully.
Always remember that any trade can fail. To protect our accounts, we focus on setups that have the best chance of success AND have a good risk to reward ratio.
Our entry is all we can control about a trade, so we have to choose carefully.
When a stock is spiking, like AAPL was on August 19, I like to buy call contracts as the price pulls back and finds support.
Like AAPL did…
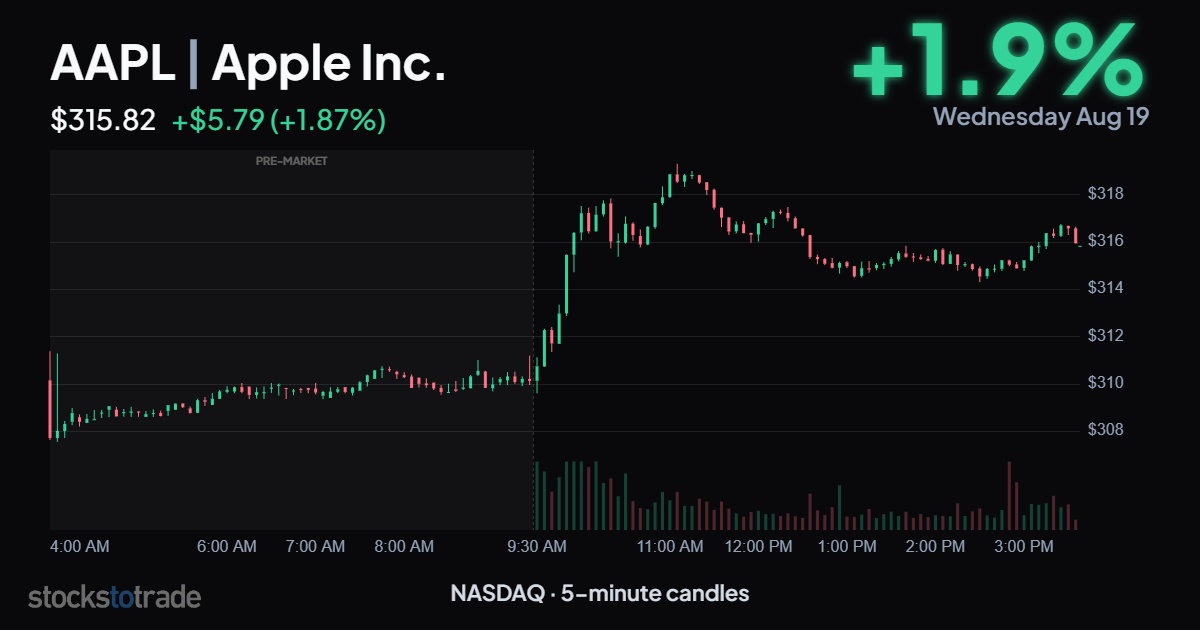
Where’s the support? Where do we buy?
Read my trade alert from August 19 at 10:28 A.M. ET:
“Bought AAPL AUG 19 $317.50 calls (on $316 pullback) at $.60 First target is $.72. Stops $.55. I want to see a bounce off the 8 EMA on the 5 minute or I’m out.”
Now look at the chart again, when the stock traded around $316 at the 8 EMA:
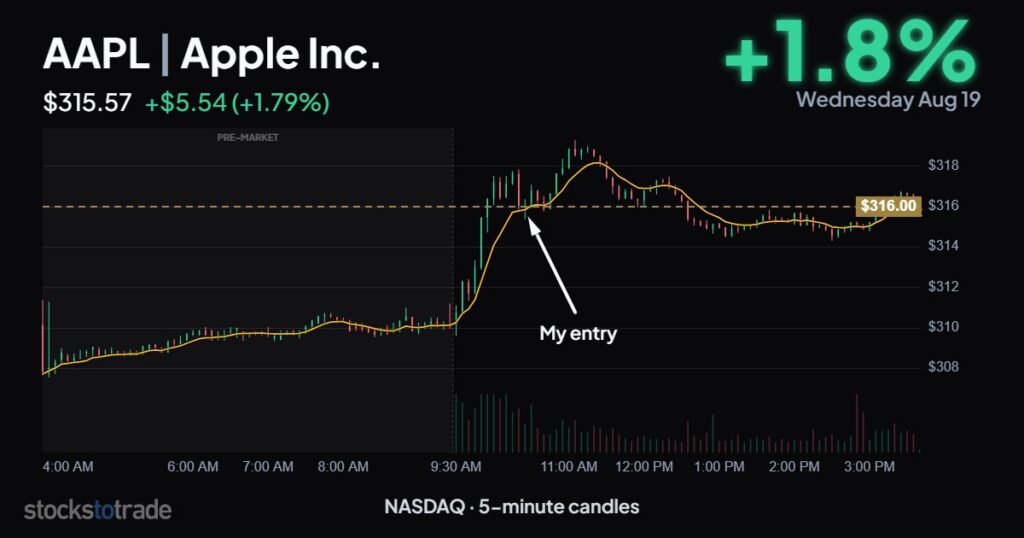
I sold at multiple levels on the bounce to new intraday highs, the last bit I sold at a 200% gain.
Here’s the alert I sent:
“SOLD AAPL AUG 19 $317.50 calls Fourth scale at $1.80 – 200% – not bad.”
The stock barely spiked 2% that morning, but my short-dated calls surged much higher.
The EMAs
EMAs measure the exact data we care about when a stock is spiking: is momentum still intact?
An exponential moving average (EMA) weighs recent candles more heavily than older ones. Contrary to a simple moving average (SMA) that would treat a candle from 40 minutes ago with the same weight as one that just closed. The EMA leans forward. That means it turns quickly when price turns, and it doesn’t drag behind a fast move the way an SMA does.
The “8” means it looks back eight periods. On a 5-minute chart, that’s 40 minutes of price action. It’s short enough to track an intraday spike in real time and long enough that a single ugly candle won’t yank it around.
That combination gives us something very valuable: a moving support level.
Static support is a horizontal line, like the $300 support level on the multi-month chart. It’s useful, but a spiking stock leaves it behind. There isn’t another opportunity to enter as the price climbs.
The 8 EMA climbs with the spike. When AAPL pulled back to $316, the 8 EMA was right there waiting.
In a genuinely strong move, buyers step in on shallow dips, and shallow dips are exactly what a short EMA tracks.
If AAPL fell below the 8 EMA, we would have quick confirmation that momentum is changing, and we could get out for a paper cut.
That solves the risk-to-reward issue. The 8 EMA moves close to the price during a strong trend, which means our risk level is tight.
An entry at $.60 with a stop at $.55. Only 5 cents of risk on the chart.
Use the EMAs to time an entry on stocks that are spiking higher.
Be good (and be good to others),
Ben Sturgill
*Past performance does not indicate future results. Not typical.