Good morning, traders…
For the past three years, trading options has been (relatively) easy…
From mid-2022 through early 2025, the CBOE Volatility Index (VIX) hovered, on average, around 20.
It bounced here and there, sure, but for the most part, markets were steady, options were relatively cheap, and directional trading made sense more often than not.
If you picked a solid breakout or pullback setup, there was a decent shot it would work — and if it didn’t, at least the risk was contained.
Premiums were affordable, and your reward could still make the trade worth it.
But that’s changed. And not in a small way.
Since February, the VIX has surged, breaking through the 30 level and at times spiking up near 60. That kind of volatility hasn’t been common in recent years, and if you’re feeling like your trades suddenly stopped working — even the ones that should have worked — there’s a reason.
We’re in a completely different volatility regime now. The calm has given way to chaos. And for options traders, that shift changes everything.
So if you’re frustrated, second-guessing your process, or wondering why even your best setups aren’t paying like they used to … you’re not alone.
The game has changed, and it’s not just about reading charts anymore — it’s about adjusting your whole approach to risk, timing, and volatility.
Let’s break down what’s really happening in this high-VIX market, why trades are costing more (but gaining less), and what you can do to maximize your gains in this unfamiliar environment…
What is the VIX?
The VIX is often called the “fear gauge,” a fitting nickname. But what it actually measures is expected volatility in the S&P 500 over the next 30 days, based on the pricing of short-term S&P 500 Index (SPX) options.
The more investors expect the market to move — up or down — the more they’re willing to pay for protection or profit. That demand gets reflected in option premiums. The CBOE takes a blend of those premiums, uses a pretty heavy formula that averages weighted out-of-the-money call and put prices, and spits out a number: the VIX.
A VIX of 15 means the market is expecting relatively mild moves. A VIX of 30 means the market expects bigger swings. A VIX above 60 — which we saw on April 7 — signals panic-level pricing. Massive moves are being priced in, day after day.
The VIX itself doesn’t measure past volatility. It’s forward-looking. And it doesn’t predict direction — it just reflects how big the moves are expected to be.
This is why experienced traders watch the VIX like a hawk. It sets the tone. A low VIX means options are cheap, calm markets are expected, and directional bets are more affordable.
A high VIX means chaos is priced in, and every option costs more, no matter which way you’re betting…
Why You’re Risking More (and Getting Less)
Market makers respond by jacking up the premiums on every option — calls and puts.
They’re not just trying to make your life harder (though it might feel that way). They’re understandably pricing in the bigger, faster, and more unpredictable moves that now have a higher probability of occurring.
This is where implied volatility (IV) comes in. Higher IV = higher option prices.
That means you’re paying more just to get into the trade. And when you’re paying more upfront, the bar for making a solid return gets way higher.
Sure, your trade might go in the right direction. But since you started from a higher price, your % return shrinks. The option might move from $10 to $12, and that’s a win … but it’s considerably worse than one that moves from $1 to $1.50.
On top of that, your downside risk is steeper. A high premium means you’ve got more to lose if the trade goes against you. So your risk is up, your reward is down, and the room for error is next to nothing.
That’s the pain of being an options buyer (vs. an options seller) when the VIX is running hot. And when it hits the kind of extremes we’ve seen recently — pushing 60 — it’s not just uncomfortable, it’s downright dangerous if you’re not adjusting.
How to Trade This VIX Regime
The answer? Stop chasing. Get selective.
When volatility is this high, the old playbook goes out the window. That trade you might have taken a couple months ago, back when the VIX was under 20 and premiums were manageable? Skip it. Marginal setups become outright terrible bets.
This is where discipline matters more than ever.
You’ve got to be selective. Like, really selective. Think A+ setups only — the ones where volume confirms the move, price action is clean, and you’re seeing Smart Money flow into the name.
The rest? Let them go. Hard pass. It’s better to wait than to press a high-premium trade that doesn’t give you room to breathe.
One more thing: in these conditions, keep your sizing in check. It’s tempting to go big when you feel confident, but when the VIX is high, risk stacks up fast.
That “just one trade” can blow up a week’s worth of progress faster than you can say “implied volatility.”
A high-VIX environment doesn’t mean you can’t trade options. But it does mean you need to be a lot more strategic.
This isn’t about working harder or watching more charts. It’s about knowing when the market’s too noisy, when premiums are too bloated, and when to only bet on your best. Your risk/reward will thank you for it.
High-VIX trading will test your patience, your confidence, and your discipline. But if you stay selective and stick to setups that actually make sense, like these…
2 Smart Money Setups I’m Trading
Let me show you two solid setups that I like, even in this high-VIX territory:
Uber Technologies Inc. (NYSE: UBER)
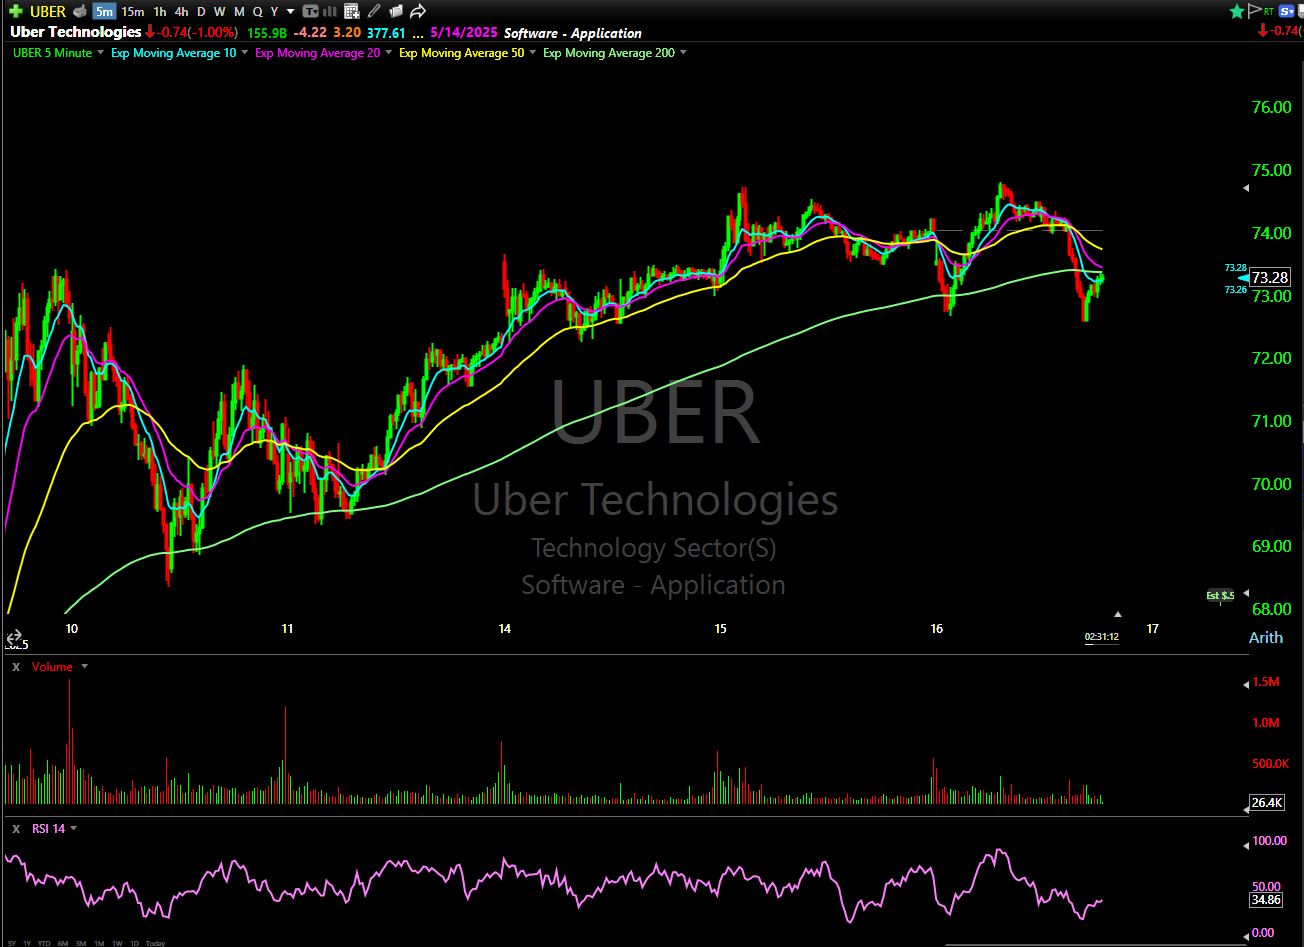
This is a pullback setup. Uber found support and bounced off a key level. I’m looking at the April 25 $73 calls, targeting a continuation higher. If it fails, my stop is near $73.80. Risk is controlled, and I’ve got time on the contracts — simple, clear, manageable.
Roblox Corporation (NYSE: RBLX)
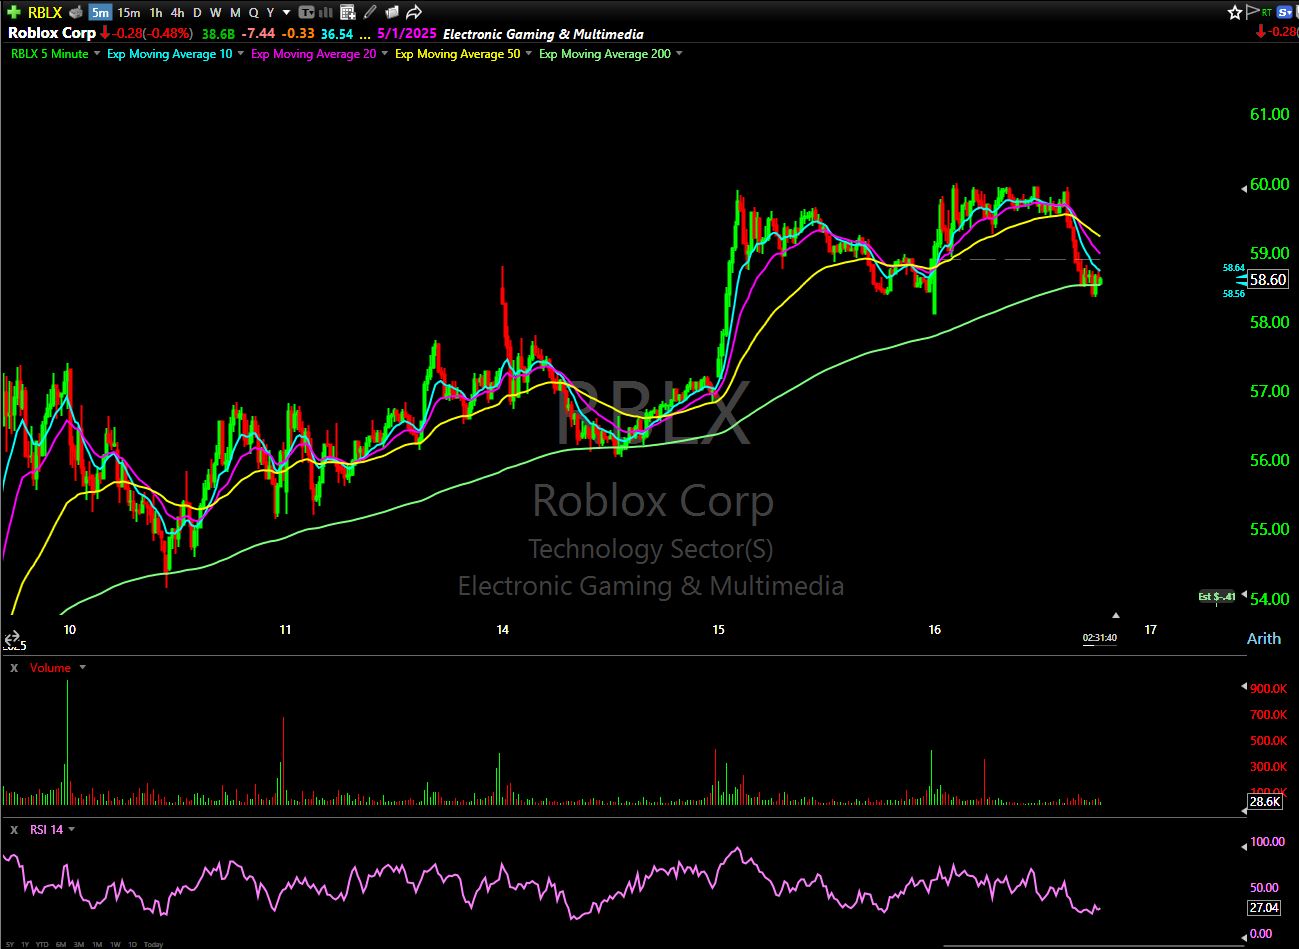
Here’s a classic breakout pattern. Price is consolidating tightly just under resistance, forming higher lows. If RBLX breaks above $60, I’m targeting the April 17 $61 calls. These were inexpensive when I called them out (around $0.40). Smart Money volume showed up, the kind of confirmation I like to see.
How did I find these setups? I’ve been using a brand-new tool … and it’s completely changed how I trade.
I’m talking about a proprietary indicator with the potential to deliver outsized gains that even my Omen Scanner won’t catch…
(And I’m even giving away a FREE TRADE IDEA using this tool that could surge over the next seven days.)
Click here to see my FINAL WARNING … before it’s too late.
Happy trading,
Ben Sturgill
*Past performance does not indicate future results