Good morning, traders…
After emerging from a horrible two-month downtrend, the SPDR S&P 500 ETF Trust (NYSEARCA: SPY) has gained more than 11% in just ten trading days — from $508 to $567:
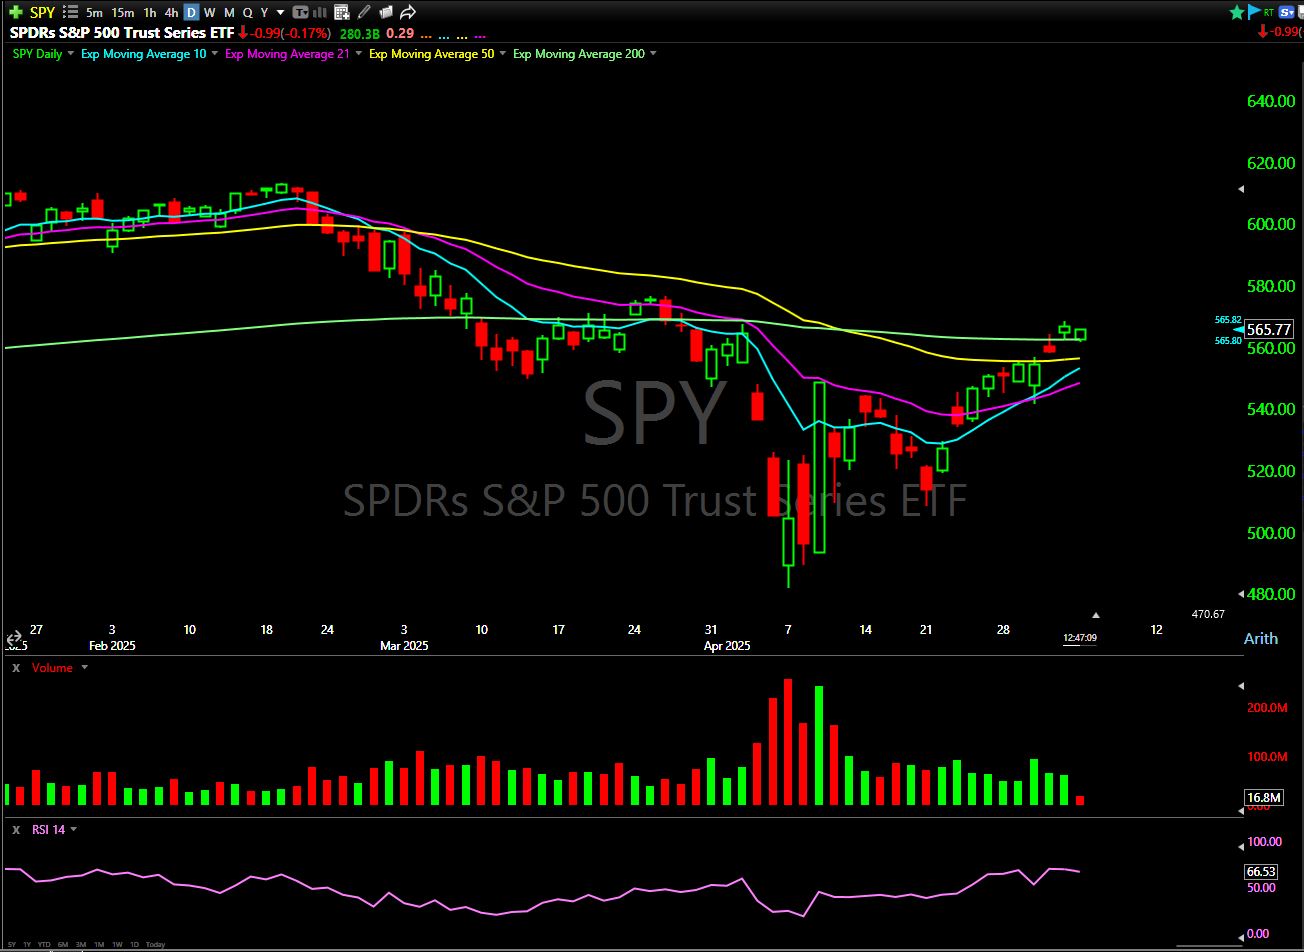
This sort of near-term bullishness makes people nervous. Traders start feeling like something’s “off,” like the run can’t possibly continue…
But you can’t let other people’s frustration (or euphoria) influence your next move.
When we see this kind of multi-day run, we have to ask: Where’s the natural resistance? Where’s the pullback point?
Right now, I see a channel forming between roughly $545 and $575 on SPY. After ten days up, we’re due for a pause or pullback, probably back toward some of the moving averages.
That’s not being bearish, it’s being realistic about the math and the rhythm of the market.
Look closer, and you’ll see signs of chop: mixed candles, a bit of a pop-and-drop pattern, fading momentum.
The market internals aren’t firing on all cylinders, but they’re showing signs of improvement from last month.
The CBOE Volatility Index (VIX) is sitting at 22 (down from a high of 60 last month):
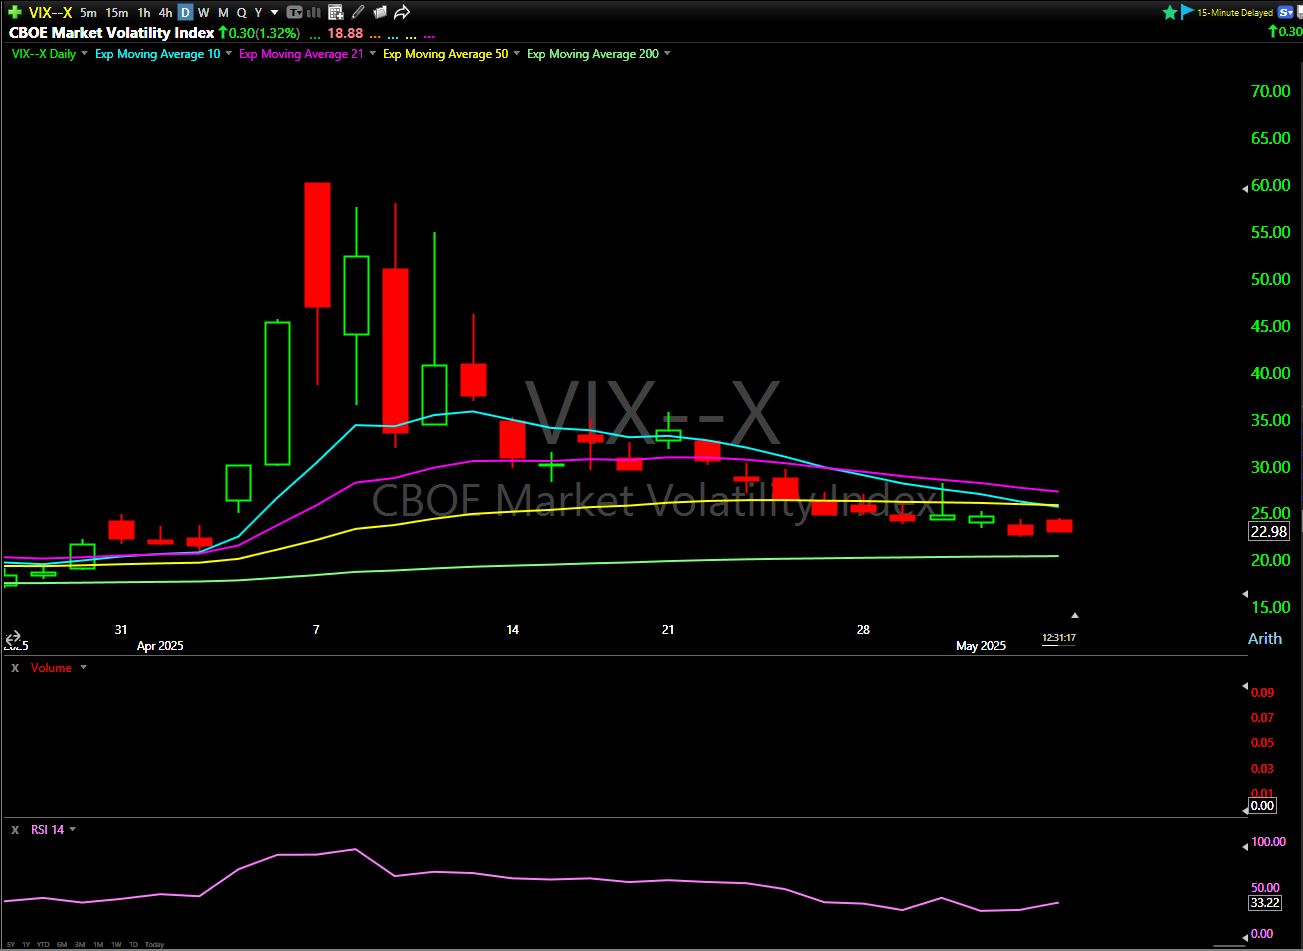
Yields are hovering around 4.2%. Oil and gold are holding steady. Bitcoin has pulled back.
If you’re trading breakouts or pullbacks, this is your moment to stay sharp.
Breakouts work best when you’ve got strong volume clearing past resistance, and pullbacks shine when price settles back on support after a strong run, consolidating calmly on lower volume.
Currently, we’re not seeing breakout conditions, we’re seeing a potential pause. That means you wait, watch, and respect the chart.
And that’s more important than ever as we head into a critical week of earnings season:
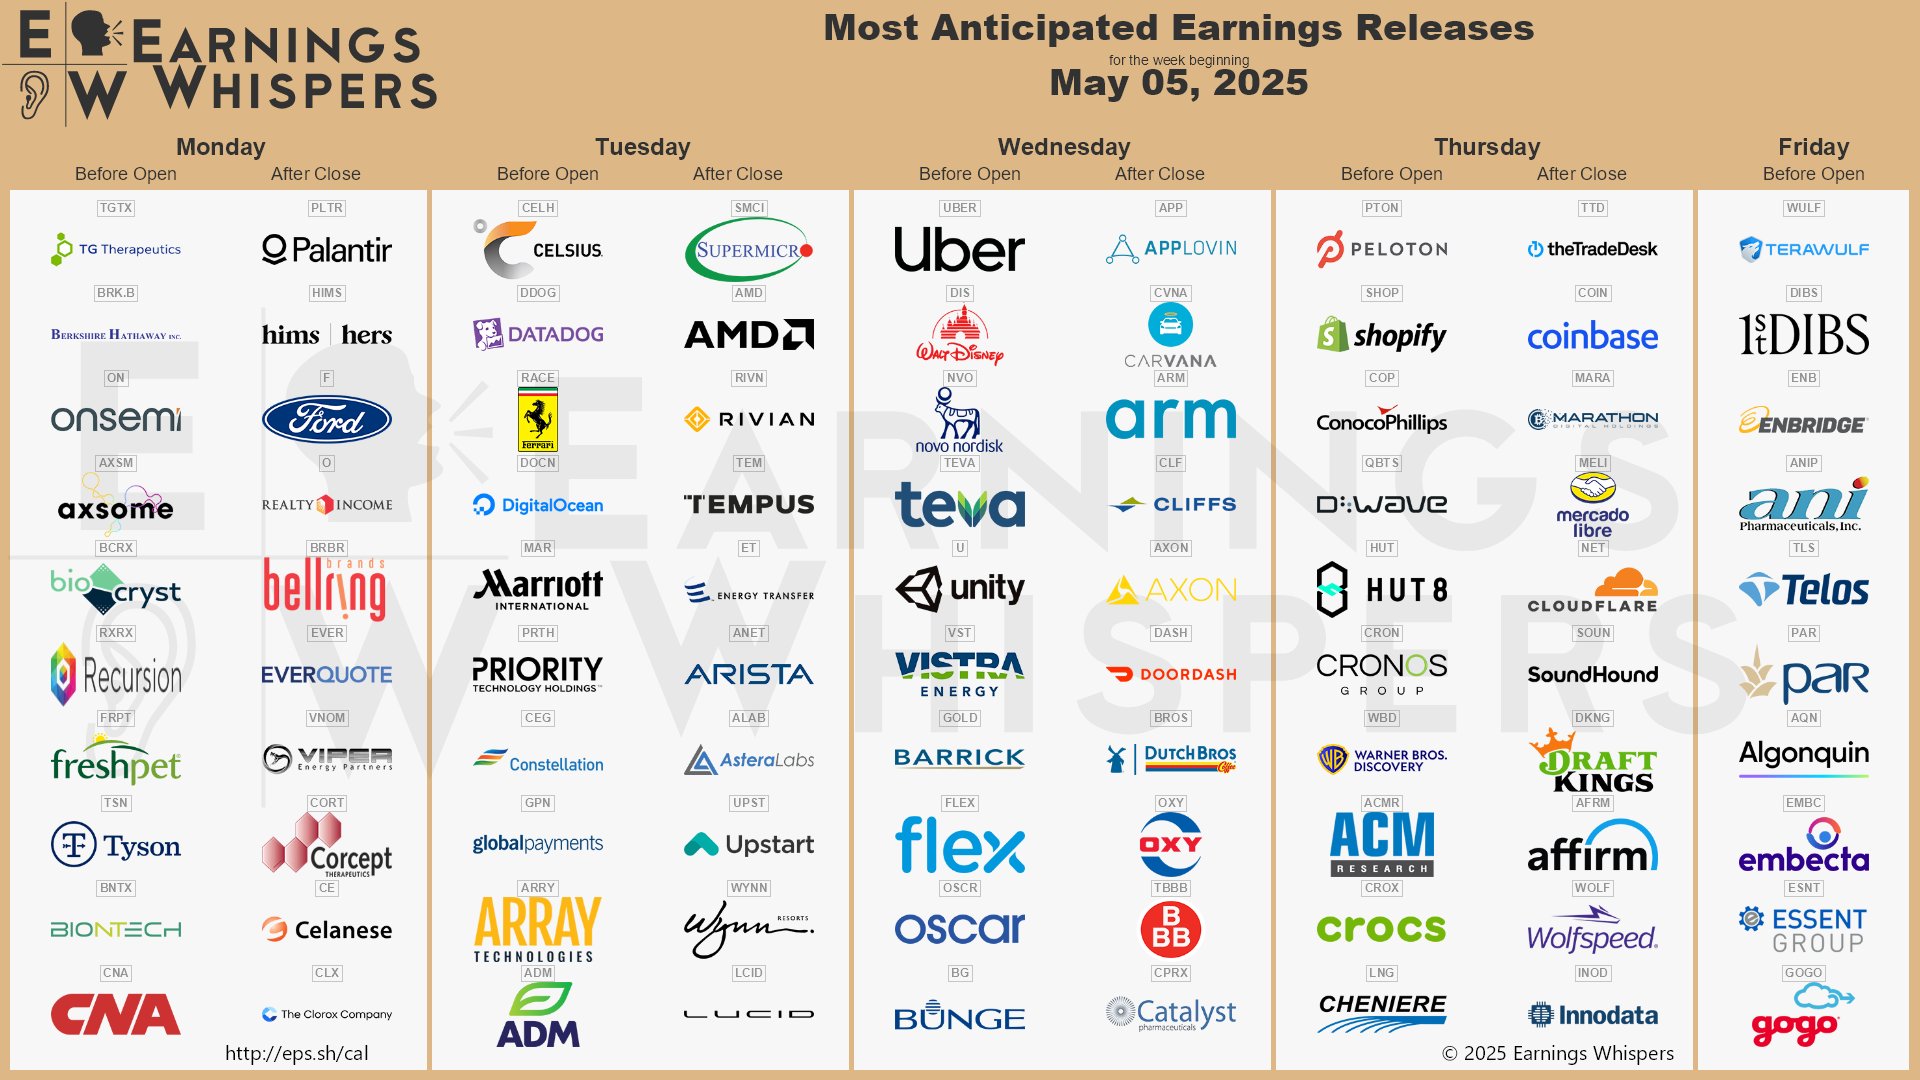
With that in mind, let me show you how I’m approaching this huge week for the markets…
Waiting for the Setup
I started the session by looking at the S&P 500 ETF Trust (NYSEARCA: SPY) and pointing out something critical: we were sitting right around the 200-day exponential moving average.
The SPY was flat, the NASDAQ Composite Index (NASDAQ: COMP) was flat, the Russell 2000 Index (NYSEARCA: IWM) was weak — basically, no one was doing anything special yet.
I reminded everyone that when we open at key price levels, we need to let the market pick a direction.
I said, “We want to see either a push higher, reclaiming the 20-day, or a breakdown that gives us short setups.” Jumping in too early would have been gambling, not trading.
This is impatience. We see a chart nearing a level and think, “Well, it’s probably going to go up,” or “It’s probably going to drop,” and we take the trade too soon.
But when the market’s telling you, “I haven’t decided yet,” you must listen.
Recognizing the Short Side
One thing I called out was that if we saw weakness, the short side might open up…
I specifically mentioned IWM as being vulnerable. I said, “If IWM breaks under $200, I’d look short.”
I also mentioned the Financial Select Sector SPDR Fund (NYSEARCA: XLF) and Regional Banking ETF (NYSEARCA: KRE), noting that banks were looking heavy.
I keep stressing to wait for the break. Don’t buy puts just because something looks weak — buy because it proves weak.
There’s no prize for being early. There’s only a reward for being right.
Watching Big Tech
I also spent time watching Meta Platforms Inc. (NASDAQ: META), NVIDIA Corporation (NASDAQ: NVDA), Microsoft Corporation (NASDAQ: MSFT), and Alphabet Inc. (NASDAQ: GOOGL).
These names were showing some strength, but not enough to justify a trade yet.
In the live room, I said, “If the market can get through the open and strengthen, I’d look for longs in these names.”
But we aren’t there yet, we’re sitting in no-man’s land.
You don’t have to trade every day. Some of the best opportunities come when you let things settle, watch where the strength (or weakness) holds, and then get in after the setup confirms.
Eyes on Rotation
This is why we approach the market top-down, looking at:
- The big picture first (rates, policy, macro data)
- The major indexes
- The sectors
- The industries
- And finally, the strongest individual stocks
In this tape, communication services, industrials, and technology are leading. But energy and some other lagging sectors might present longer-term opportunities once they cycle back up.
Keep an eye on that rotation — the Smart Money almost always moves ahead of the indexes.
Lastly, for those working with smaller accounts, size your trades carefully. Stick to affordable options (around $1 or less).
This market is offering plenty of setups, but most importantly, your account needs to make it to trade another day.
Happy trading,
Ben Sturgill
P.S. With big tech earnings smashing expectations, we have the perfect tool to maximize opportunities…
Earnings Edge.
The same tool that delivered 100 winning trades in a row last season.*
Join Danny Phee for a LIVE Earnings Edge WORKSHOP — TODAY, May 6 at 7:00 p.m. EST.
Click here to reserve your seat.
*Past performance does not indicate future results