Good morning, traders...
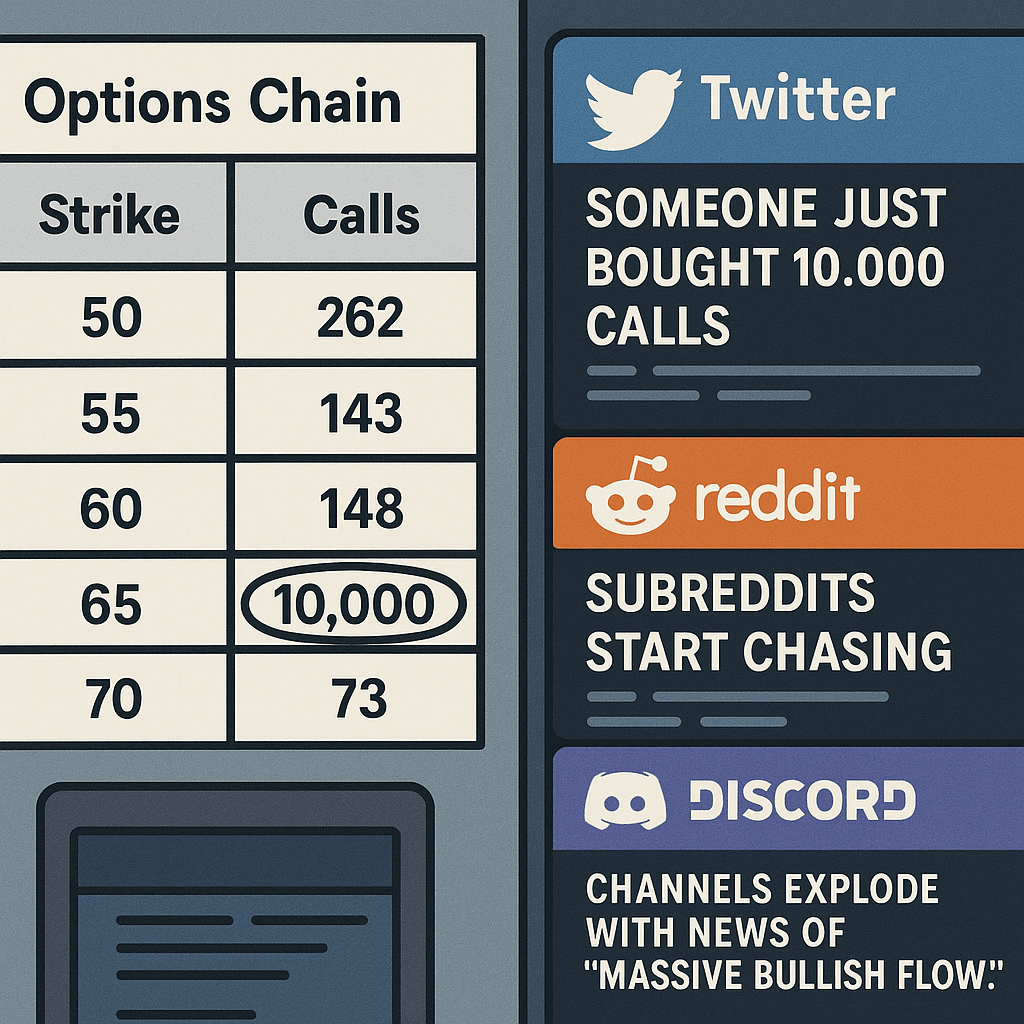
Let’s say you open an options chain and notice someone just bought 10,000 calls.
Twitter lights up. Subreddits start chasing. Discord channels explode with news of “MASSIVE BULLISH FLOW.”
What’s your first instinct?
You’re probably scrambling to figure out what the mystery trader knows…
Is there a buyout coming? Earnings leak? Inside information?
So you buy calls.
You’re following the Smart Money, right? You’re doing what the pros do.
Then the stock drops 10% the next day. Your calls lose 95% overnight.
What happened? You got fooled by a hedge.
But wait…
Calls are bullish, right? How could buying calls be a hedge?
If an institution is short a stock, it might buy calls to protect itself from big upside moves in that stock.
If the stock rips higher, those calls offset their losses on the short position.
What looks like bullish flow to you may actually be an institution protecting a short.
That’s the opposite of bullish.
Yet you just bought calls, thinking you were following Smart Money into a directional play…
When in reality, you were following someone buying insurance against a short position you didn’t even know existed.
Unusual options activity can be one of the most valuable tools in your arsenal … if you know how to read it (and use the right tools to do so)…
But seeing big call volume and assuming it’s “bullish” is a recipe for disaster.
Let Me Show You How To Trade Unusual Options Activity Without Falling For The “Hedging Trap…”
Why I Track Unusual Options Activity
Unusual options activity is when someone places a trade much larger than what the stock normally sees.
When someone buys 5,000 call contracts on a stock that usually sees 200 contracts per day, that’s unusual.
It stands out. And it gets flagged by scanners that track order flow.
The assumption is that someone with a lot of money knows something you don’t. And if you can follow their lead, you can profit from the same information.
Sometimes that’s true. Institutional traders, hedge funds, and insiders do make directional bets that show up as unusual activity.
That’s what my entire Smart Money trading strategy is built around.
But institutions also use options to hedge their long-term positions, manage risk, and neutralize exposure.
And if you aren’t using the right tools, those trades look identical to directional bets when they appear on an options chain…
The Hedging Trap
Let’s say a hedge fund owns 1 million shares of a tech stock.
The portfolio managers are obviously long-term bullish.
But earnings are coming up, and they need to protect a multi-billion-dollar position against potential downside.
So they buy 10,000 put contracts.
That trade hits most scanners as “bearish flow.”
Retail traders see it and think: “Smart Money is betting against this stock.”
But the hedge fund isn’t betting against the stock … they’re protecting their long position.
If the stock drops, the puts offset their losses. If the stock rallies, they lose the premium, but their shares go up.
They’re neutral. You’re not.
Hedges vs. Directional Bets: 5 Ways To Tell The Difference
Here are five ways to investigate whether that “massive flow” you’re seeing should be taken at face value … or not.
See What The Stock Is Doing
If unusual activity is in puts and the stock has been rallying, institutions are likely hedging long positions. Calls after a selloff might be hedging short exposure.
Consider The Strike Price
Deep out-of-the-money options with enormous volume are often hedges.
When Smart Money makes directional bets, they usually cluster closer to at-the-money strikes where the trade has a realistic chance of profiting.
Check The Expiration Date
Short-dated unusual activity (weeklies) is more likely directional. Longer-dated activity (60-90 days out) or dates near earnings reports? That’s often hedging.
Watch The Bid/Ask
If the trade was filled at or above the ask, someone paid up, suggesting urgency.
Look For Matching Trades
Large call volume and large put volume at the same time, at or near the same strikes?
That’s a straddle, strangle, or collar …. not a directional bet.
How I Use Unusual Options Activity
I don’t chase unusual options activity blindly. I use it as a confirming signal.
If I’m already watching a stock for a technical setup and I see unusual call volume that aligns with my thesis, that adds conviction.
But if unusual activity shows up on a stock I’m not watching, I don’t pile in. I check the chart. I look at the context.
This is why I use my OMEN Scanner.
It’s specifically designed to zero in on directional bets using proprietary criteria that filter out anything other than real, directional bets.
I never have to worry about sorting hedging traps from reliable volume.
OMEN does that for me.
Why This Matters Now More Than Ever
Heading into earnings season next week, this problem gets trickier.
Options volume explodes around earnings.
Institutions load up on puts to hedge long positions. They buy calls to protect short exposure.
How can you tell which volume represents directional bets versus hedges?
That’s why I use Earnings Edge.
Mr. Anderson built this system with 57 criteria and over 950,000 lines of code to identify earnings setups where probability heavily favors one direction. It’s been predicting earnings beats and misses with 89% accuracy.
He recently grew a small account from $3,000 to $32,000 in 52 days using our Earnings Edge system.*
TONIGHT, October 8, Mr. Anderson is sharing his NEXT CALCULATED EARNINGS MOVE FOR FREE.
Save Your Seat For Tonight’s Briefing BEFORE It’s Too Late.
Happy trading,
Ben Sturgill
*Past performance does not indicate future results, not typical