Good morning, traders…
Why did you make your last trade?
Really think about that question.
If you can’t answer in fifteen seconds, your process is lacking clarity.
And that’s a fatal flaw in your trading strategy.
I’ll notice students “throwing darts” at the market, chasing any stock that looks good on any given day, seemingly without any connective tissue between the setups…

But when you have hundreds of thousands of options contracts to choose from daily, “seeing what sticks” isn’t gonna work.
Strike prices, expiration dates, implied volatility, The Greeks … there’s a lot to unpack.
The question is: Do you know exactly what you’re looking for in the options market?
After 22 years of trading through wins, losses, successes, failures, crashes, rallies, and more — I’ve identified four factors I look for in every options trade.
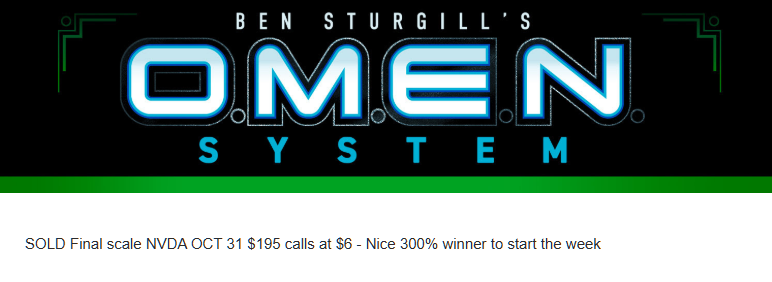
It was these 4 traits that led to my 300% win on Nvidia Corporation (NASDAQ: NVDA) this week…*
Wish you could find trades like that one?
Start Doing This…
Step #1: Smart Money Sweeps
I want an unfair advantage in the options market.
That’s why I focus on trading contracts with big Smart Money sweeps.
Since building my OMEN Scanner, I’ve achieved an 80%+ win rate* across all of my options trades.
How? Information.
That’s what sets big institutions apart from retail traders in their Mom’s basement.
By following the Smart Money, I can base trades on data I don’t even have.
I don’t need to know the material, non-public information these mysterious traders might be using…
I just need to know what to look for, pay close attention to my scanner, and pull the trigger when the opportunity presents itself.
Even if you narrow your watchlist down to bets from my scanner, you’re still left with a lot of contracts to choose from…
How can you know which Smart Money setups have the best chance of working?
Step #2: Options Volume
Options volume shows you how many contracts have been traded today. It’s a snapshot of near-term demand.
For short-term swing and day traders, volume is paramount. It’s like a heartbeat, showing the size and action of the market for that day.
Imagine there’s big news, like a company announcing a new product.
You’ll see that contract’s volume shoot up. It’s like a big flashing sign saying, “Hey, look over here! These contracts are flying off the shelves!”
By keeping an eye on options volume, you can get a feel for what contracts have high demand (and which don’t).
This can give you double confirmation of where the smart money is flowing, beyond what you see on my scanner.
Step #3: Open Interest
If volume measures short-term liquidity, then open interest is its long-term counterpart.
Open interest represents the total number of active or “open” options contracts for a particular strike price and expiration date.
It tells you how many contracts are currently held by buyers and sellers, regardless of when those contracts were purchased.
By monitoring open interest, you can track where the Smart Money is moving … and staying.
Step #4: Pattern Recognition
Options trading is all about direction.
If the underlying stock doesn’t go in the direction of your contracts, your position is toast.
So, after identifying a smart money sweep with big volume and open interest, my next step is to confirm the setup on the chart.
- A Smart Money bet with a bad chart? Pass.
- A great chart with no Smart Money interest? Pass.
- A gorgeous chart with tons of Smart Money options volume? Bingo.
There are two directional chart patterns I’m always looking for:
The Breakout Pattern
A breakout occurs when a stock surpasses its support or resistance levels.
These levels represent the price points where the stock has struggled to move beyond during a specific period.
Breakouts are a strong indicator that the stock is likely to continue its trend.
You could be in at the beginning of something BIG…
But there’s a catch:
Some breakouts eventually prove to be false breakouts — when a stock cracks a key level, lulling traders into a trap, only to quickly drop back below (or above) it.
The key to identifying a breakout vs. a false breakout?
Daily trading volume.
If I see a stock crack a resistance level on low volume, I won’t be rushing to buy calls.
But if I see a break above a key level with huge daily trading volume — ideally bolstered by even more options volume — I’m adding that name to my watchlist immediately.
The Pullback Pattern
The Pullback Pattern is exactly what it sounds like…
The share price “pulls back” to a support level — often after a strong move higher.
This is due to profit-taking. Traders hit their price target and sell, causing a pullback.
Then, after holding the support level, the price reverses back to the upside.
But where you want to see high volume on a breakout, you want to see lower volume on the pullback.
CAUTION: If there’s enormous selling volume, that’s usually a sign that something’s seriously wrong with the stock. That’s not what we’re looking for with pullback trades.
The benefit of low-volume pullbacks is that the risk/reward improves.
A few minor red days after a big run-up can take a huge bite out of call option premium, giving you a beautiful entry price (and better risk/reward).
Stop throwing darts and start looking for these four traits.
But don’t do it alone…
Join Us TOMORROW, October 30 at 4:00 p.m. EST for a LIVE Smart Money WORKSHOP.
Happy trading,
Ben Sturgill
*Past performance does not indicate future results