Good morning, traders…
I’m starting today with a story not about trading, but about dancing…
A few years ago, my wife signed us up for a ballroom dancing class.
I know, a 6’8” white guy doing the Viennese Waltz might not put the most graceful image in your head.
And you wouldn’t be totally wrong.
But I did my very best at hitting the tiles because I love my wife so much. Happy wife, happy life.
Our instructor, Federico (a.k.a. Fancy Fred) was this stylish Venezuelan guy who took his craft very seriously.
One night, mid-spin, I was feeling myself a little too much and decided to let the hips go. You know, really move.
Fred walked over with purpose, tapped me on the side, and said in his thick accent, “No, no, no! Too much hips. Stop it.”
The irony is that Fred was right. I wasn’t there to be the star. I was there to make my wife shine.
And that lesson from the dance floor has shown up in my trading life too…
When I stop trying to make trading about me and let the setups do the work, I get a lot more consistent (and bag way bigger gains).
This week, I want to walk you through three setups from recent live sessions that stood out — and why I’m leaning into one pattern more than others lately…
Setup #1: The Bull Flag Pullback
One of the charts that really caught my eye this week was Direxion Daily TSLA Bull 1.5X Shares (NASDAQ: TSLL).
TSLL gives you exposure to Tesla Inc. (NASDAQ: TSLA) without shelling out $300+ per share, and it’s liquid enough for quick in-and-out trades.
The price action is showing a clean bull flag on the daily, nice and tight:
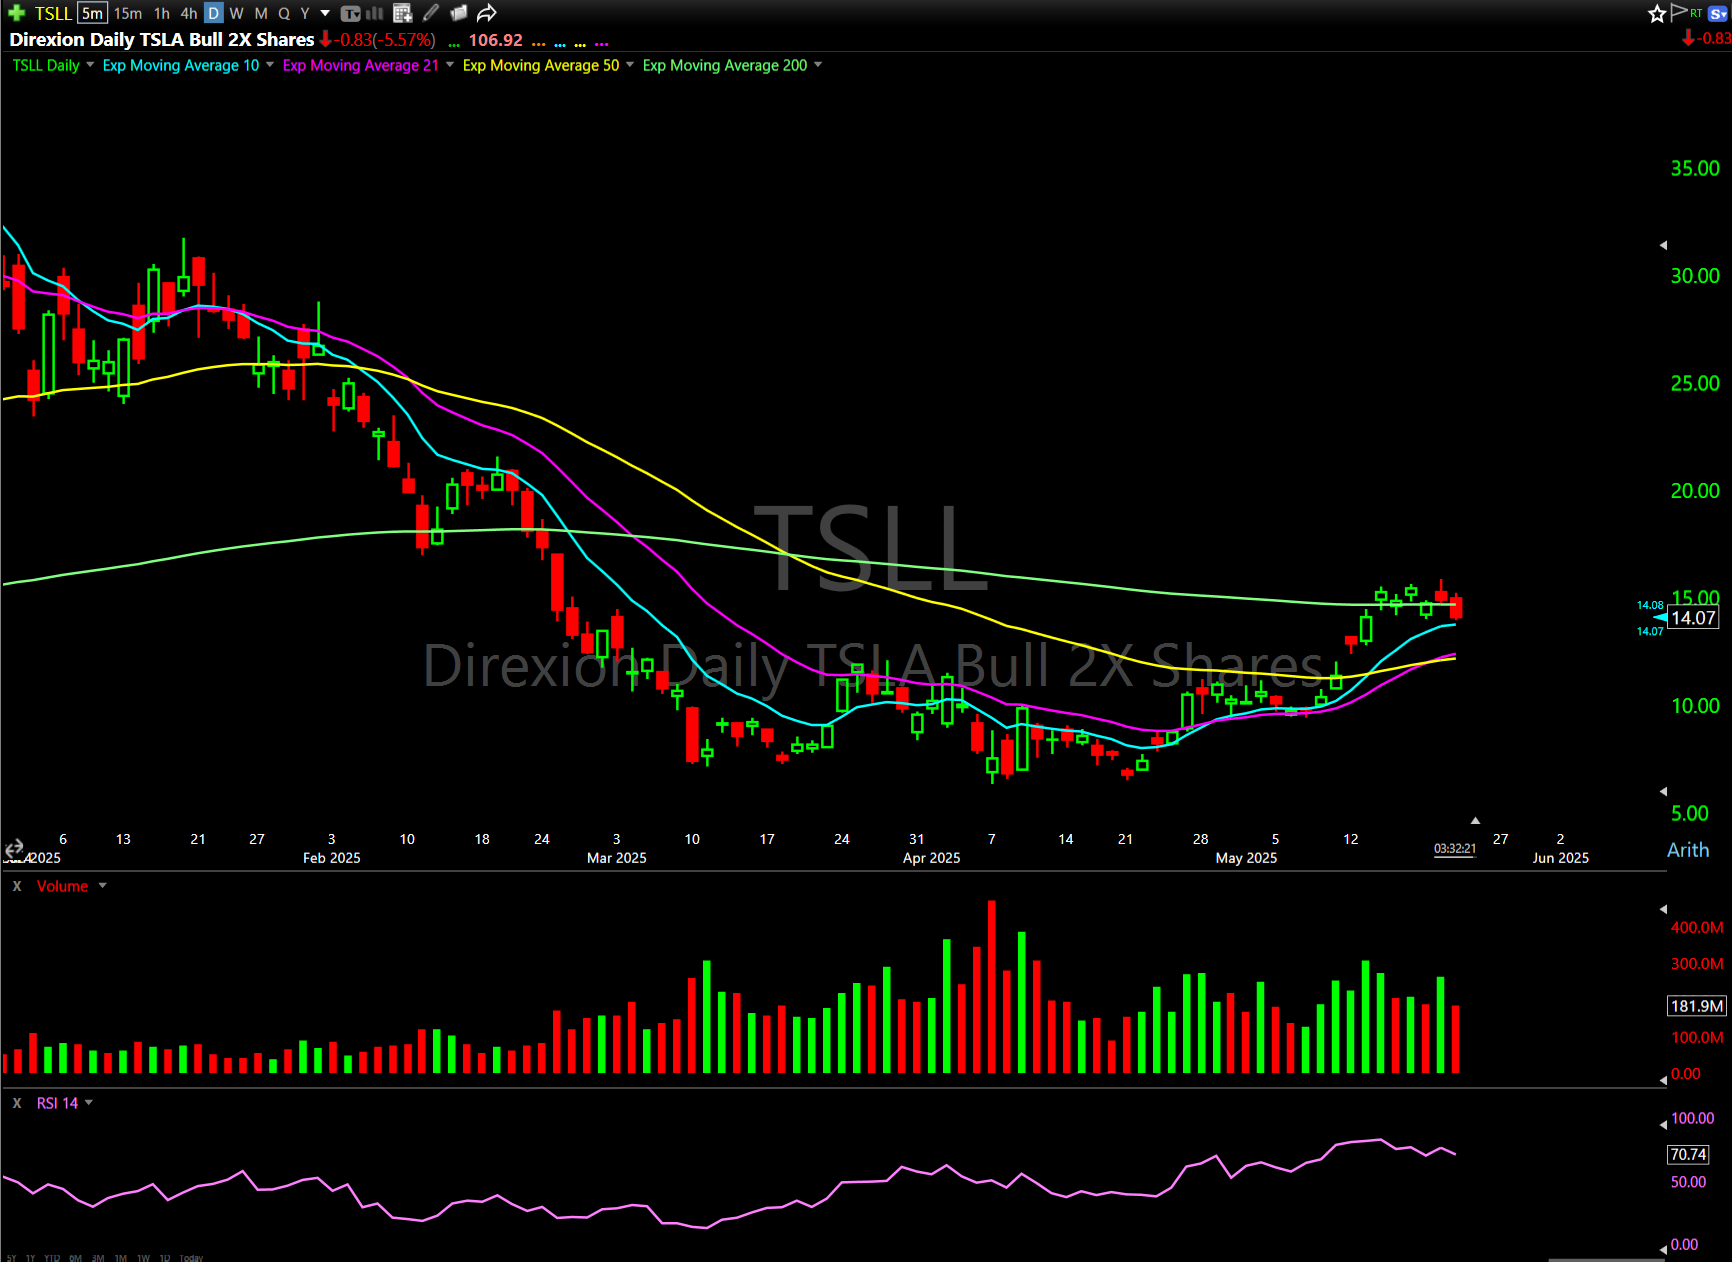
I like it anywhere in the $15.00 to $14.70 zone. When I see that kind of consolidation after a run, I’m thinking: “This is the rest before the next leg up.”
Run, rest, run.
I’m looking at the May 30th $14 calls, especially if the share price stays near (or dips below) $15.
The idea here isn’t to catch the breakout at the top but to get positioned while the trade is resting and risk is lower.
Setup #2: The Moving Average Test
Marathon Digital Holdings Inc. (NASDAQ: MARA) is a classic crypto stock I’ve been watching closely ever since I called out that $75,000 level on Bitcoin (BTC) a while back.
Since then, we’ve bounced and consolidated beautifully. MARA is now pushing through its 200-day simple moving average:
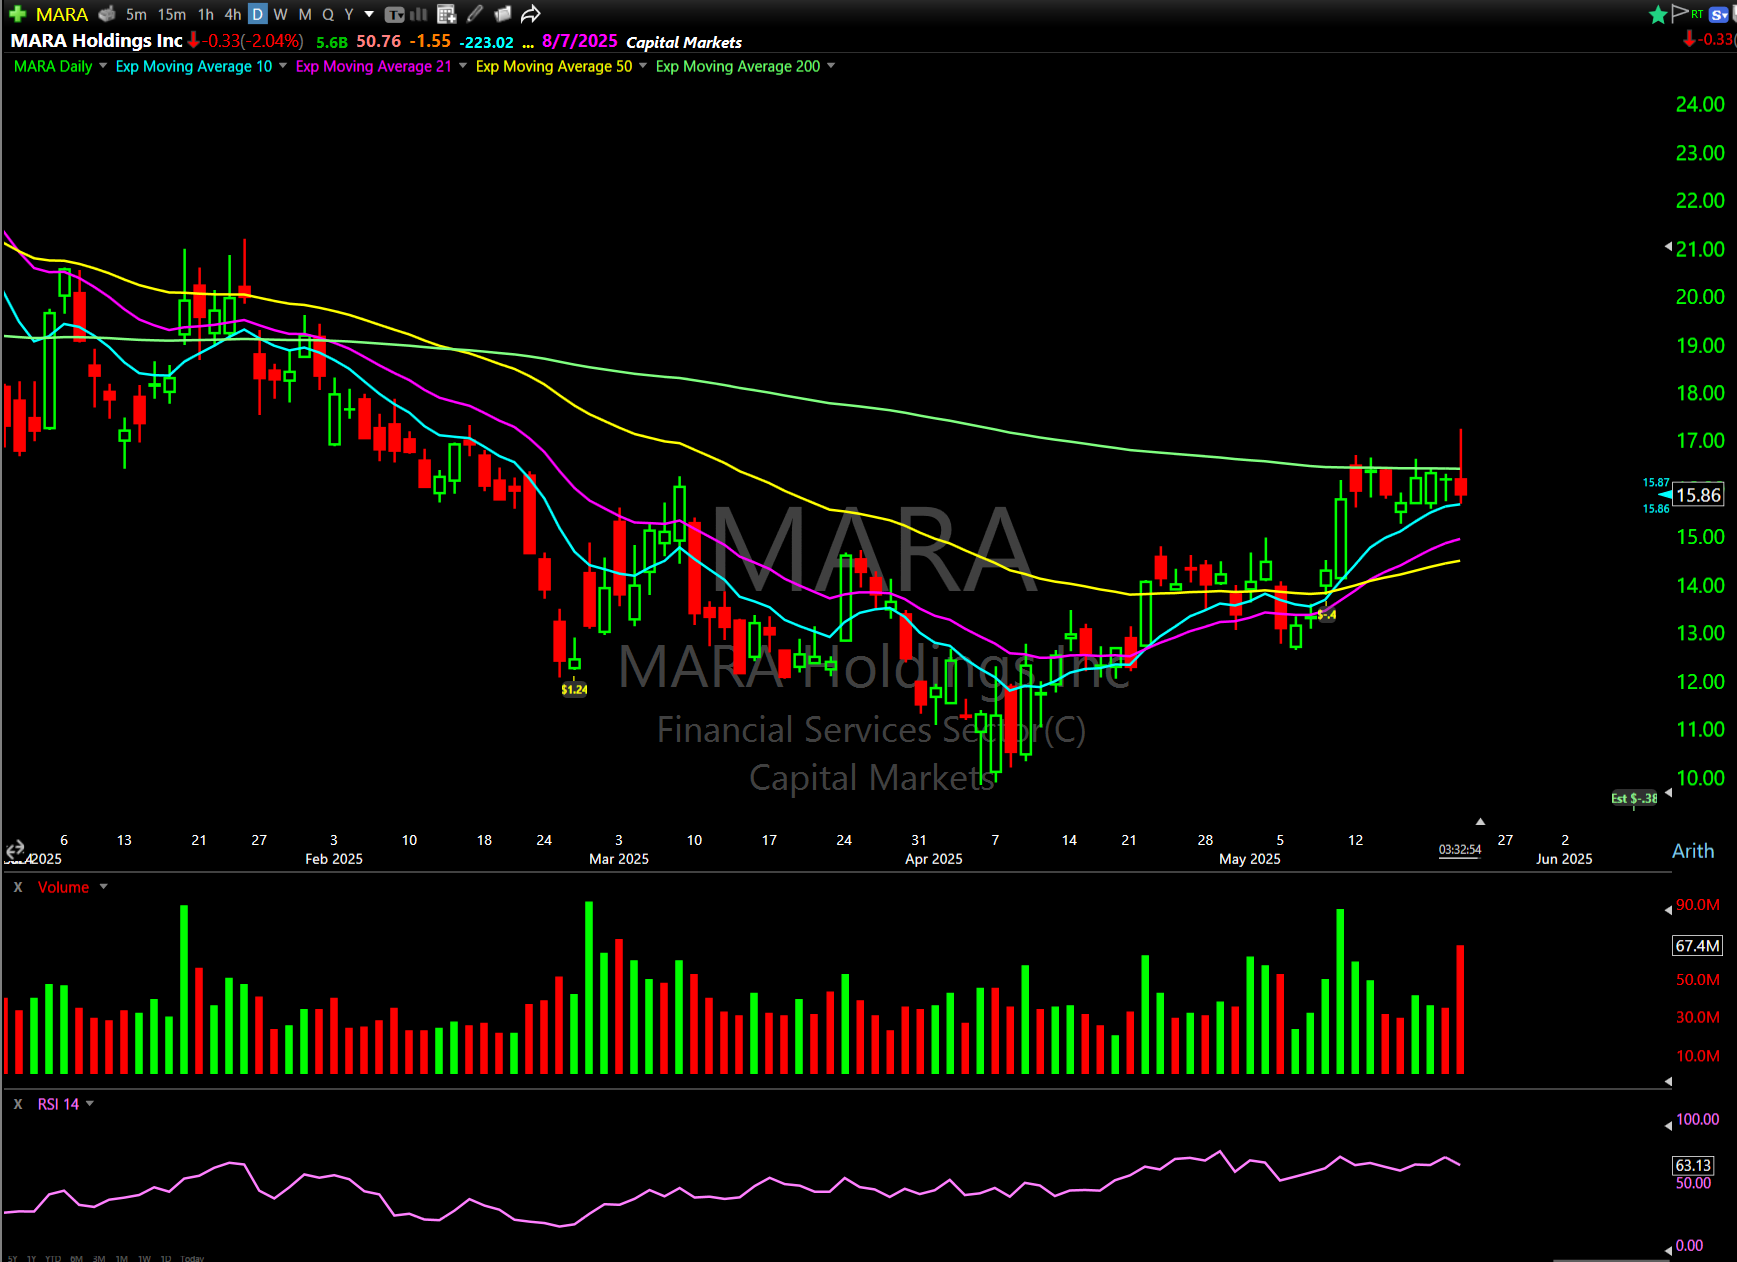
What stood out was the Smart Money flow…
I saw massive premium buying into the June 6th $14 calls, over $1.6 million in trades. That kind of interest gets my attention.
That said, it’s not cheap. If I can get this one on a pullback, especially in the $16.70–$16.80 zone, that’s where I’d like to be positioned.
Like TSLL, I’m not chasing the rip. I’m waiting for it to take a breath.
Trade Setup #3: The Potential “Blue Sky Breakout”
Robinhood Markets Inc. (NASDAQ: HOOD) has some of the craziest options flows I’ve seen recently.
We saw sweeps, above ask, repeaters, odd expiration weeks. Basically, all the signs of aggressive Smart Money buying the June 6th $66 calls.
But what makes this one really interesting is the structure of the chart.
It’s right at a breakout zone, testing highs with minimal resistance above, a potential “blue sky breakout” situation:
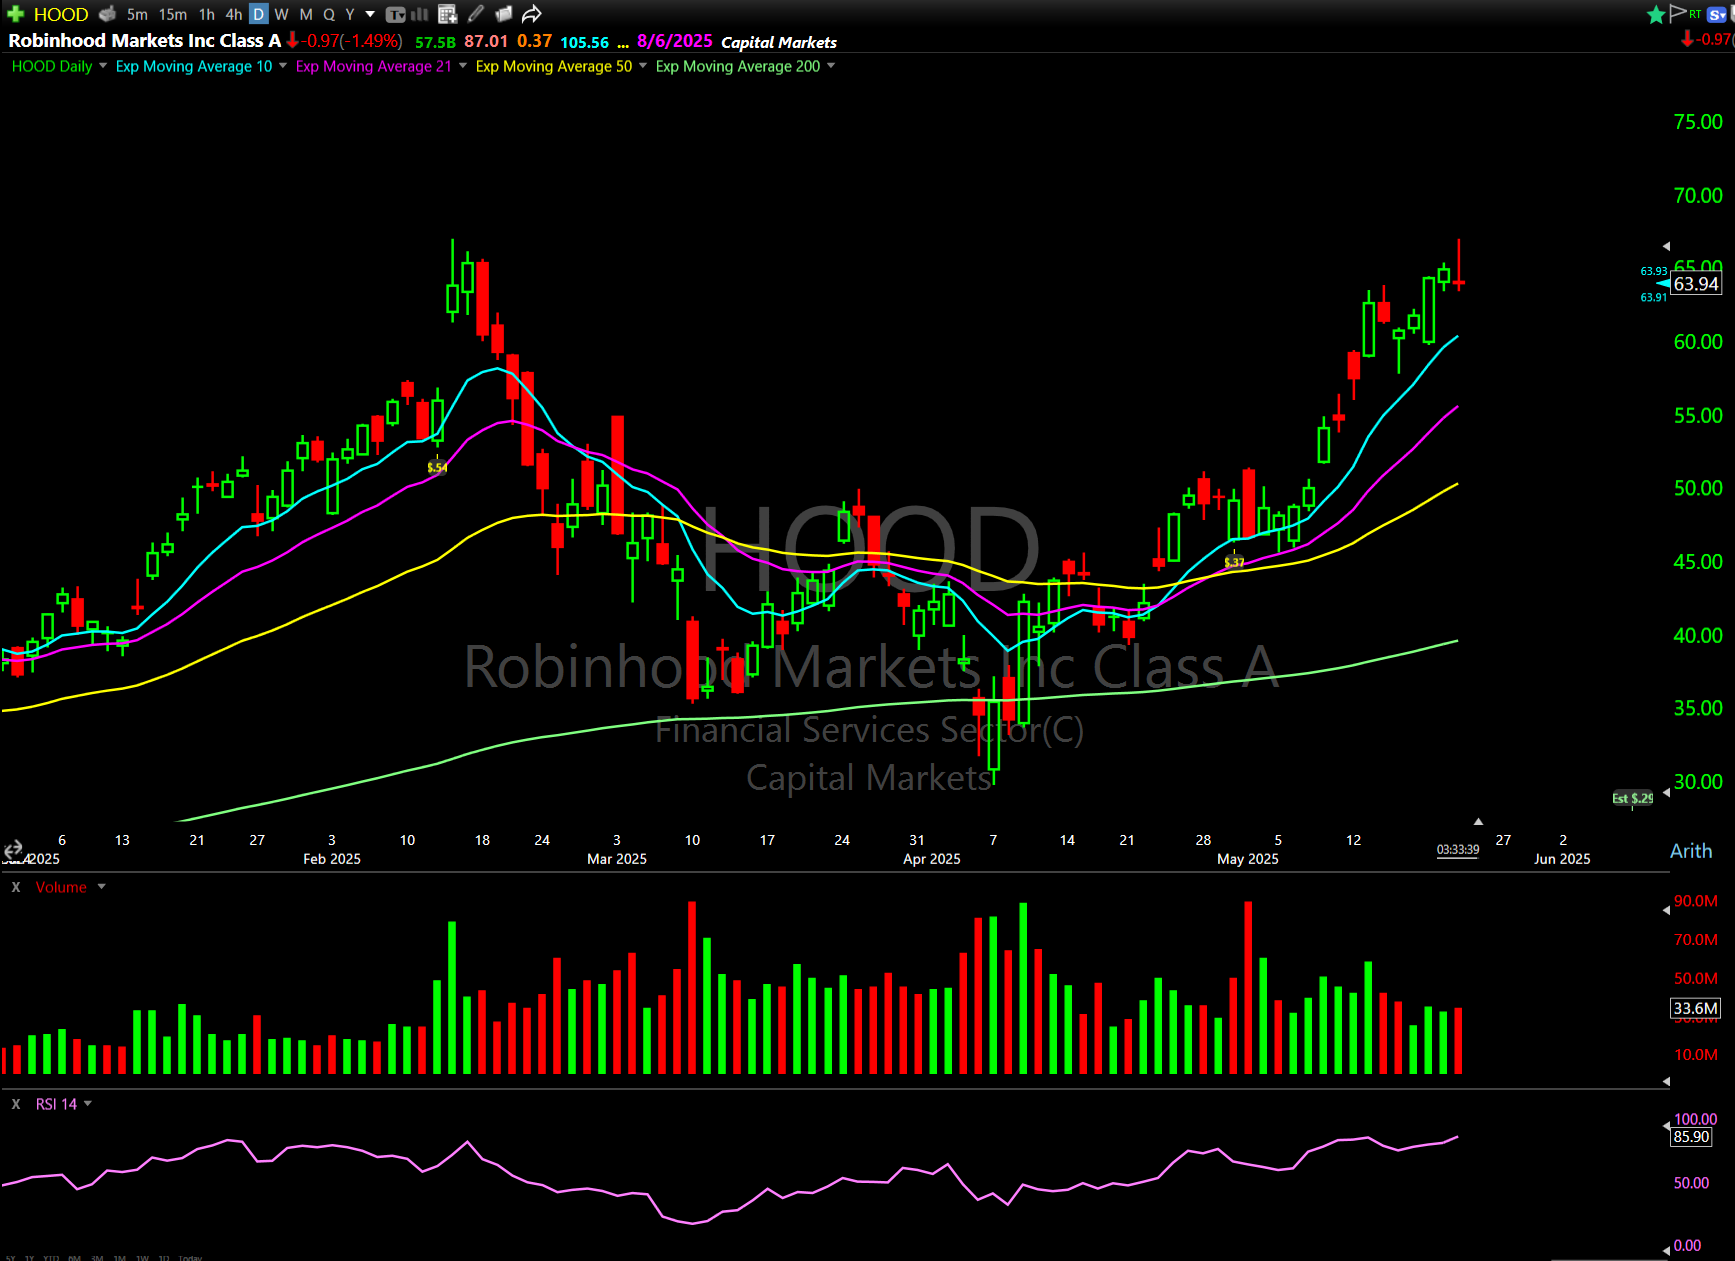
I want a pullback into the $66.40 zone. That would give me enough room to manage the trade and keep my risk tight.
What These Setups Have in Common
All three setups above are pullbacks. I’ve been preferring pullbacks over breakouts in this tape for a very simple reason…
With the influx of newer traders and the way markets have been moving, I want setups that allow for tighter risk management.
Right now, the best moves aren’t breakouts, they’re pullbacks that let the chart breathe and give you a better entry.
Getting in after a stock has made its initial move means I can define my risk better, and I’m not forced to chase.
I still love breakouts, but I’ll call those out more selectively.
Pullbacks, especially into key levels with strong volume and Smart Money flow, offer a great blend of risk and reward here.
A Quick Note About Hedging
When the market starts stretching to its outer edges — like now, when it’s creeping back towards all-time highs and hitting 2x or 3x ATR (average true range) — I know it’s time to hedge.
One tool I use is Direxion Daily S&P 500 Bear 3X Shares (NYSEARCA: SPXS). Then I sell those shares back as SPY returns to the average.
I’m not predicting a crash, I’m simply playing the probabilities.
Over 95% of the time, price reverts to the mean.
For smaller accounts, you can buy SPXS calls a couple of months out. Let’s say you grab July $5 calls for 70 cents. If SPXS bounces even modestly, you’ve got a chance to double that capital, which can help offset any other drawdowns in your portfolio.
Keep your hips square, your risk tight, and your hedges on.
Happy trading,
Ben Sturgill
P.S. If you want access to the system that achieved an 89% win-rate with a 72% average gain…*
From which the top 120 trades have ALL generated 100% or higher — with 27 soaring above 200%, and 12 exploding beyond 300%…*
Then NOW is the time to start using my OMEN System.
Join the great Aaron Hunziker, TODAY, May 22 at 2:00 p.m. EST for a LIVE OMEN TRAINING SESSION.
This is your last chance to sign up — Click here to reserve your seat.
*Past performance does not indicate future results