Good morning, traders…
What’s the hardest part of trading?
Not trading.
Sitting on your hands when the market is chopping, waiting for the right setup instead of forcing trades — it goes against everything we want to do.
Plus, that’s not always the right approach.
So how can you know when to get aggressive and when to stay cautious?
You can’t just guess. You need data. You need something telling you whether the market has your back or whether you’re swimming against the current.
I’ve been tracking one indicator that’s been saving my portfolio this week. It’s not some fancy algorithm or expensive software.
It’s free. It’s real-time. And it tells me in seconds whether I should be pressing the gas or sitting on the sidelines.
This indicator shows me the pulse of the market. Not what happened an hour ago, but what’s happening right now.
When it’s positive, I get aggressive. When it’s negative, I protect my capital. When it’s neutral, I wait.
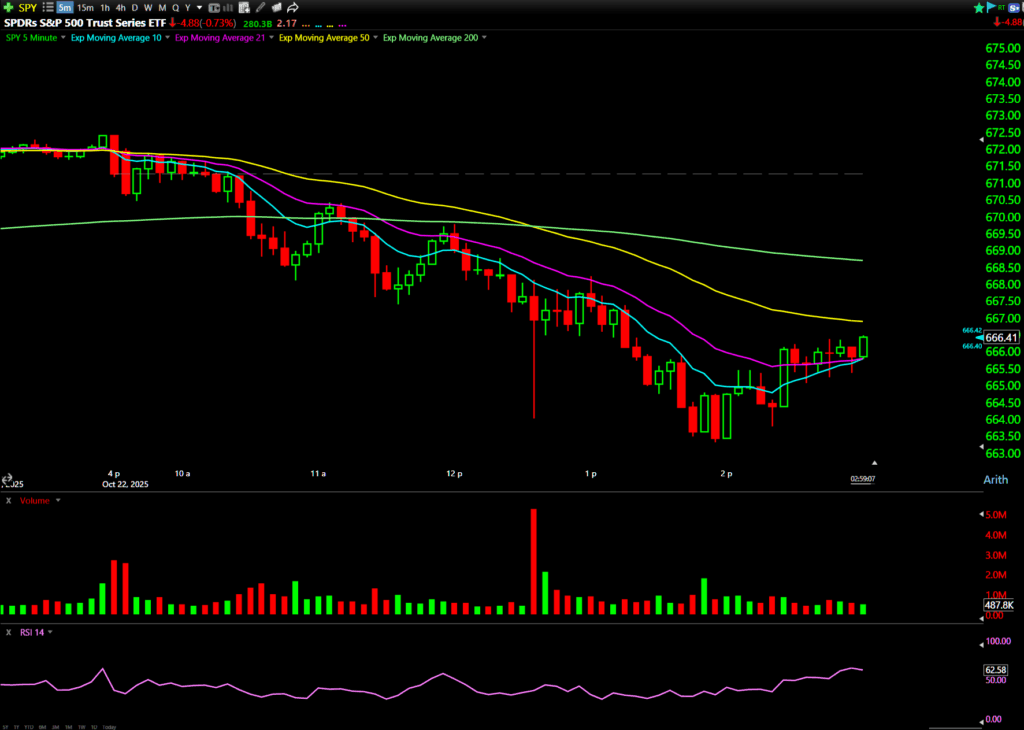
It saved me from yesterday’s big red day:
The craziest part is: 95% of traders ignore this indicator.
They focus only on price action, completely missing what’s happening underneath the surface.
This Trick Just Saved My Portfolio.
What the $TICK Measures
The indicator I’ve been tracking is the $TICK Index
It measures how many stocks on the NYSE are trading on an uptick (price moving higher) versus a downtick (price moving lower), and it gives you a net number.
Here’s what the numbers mean:
Positive $TICK (e.g., +500) = More stocks are trading on an uptick than a downtick. This is bullish pressure. The market is buying.
Negative $TICK (e.g., -800) = More stocks are trading on a downtick than an uptick. This is bearish pressure. The market is selling.
The $TICK fluctuates constantly throughout the day. It’s a live feed of market sentiment. You’re watching the tug-of-war between buyers and sellers play out in real time.
Traders use the $TICK to read the pulse of the market. It’s especially useful for deciding:
- When to enter and exit trades.
- Whether there’s broad market participation behind a move.
- If the market is buying strength or selling weakness.
How I Use the $TICK
When the $TICK is consistently below zero, selling pressure dominates. This is when I’m either hedging with puts or sitting out entirely.
Why force a long trade when the entire market is selling?
When the $TICK is above zero for most of the day, that’s bullish. The market is buying. This is when I favor calls, breakout trades, and momentum setups.
If the current is flowing in your direction, swim with it.
Context matters. I don’t trade the $TICK in isolation. I pair it with other tools like the VIX, VWAP, and relative strength.
The $TICK tells me the market’s overall mood. The other tools tell me where to apply that information.
If the market is a party, the $TICK is the DJ.

If he’s playing sad tunes ($TICK below zero) — don’t dance.
Wait for the music to change before you hit the tiles.
What The $TICK Is Telling You Now
Right now, the $TICK is showing weakness…
There are more stocks on downticks than upticks, which means selling pressure is controlling the tape.
I’m monitoring whether it flips back above zero or stays stubbornly below.
A consistent move into negative territory will indicate that selling pressure is increasing.
But if the $TICK starts to turn up (towards positive +500 to +800 or higher) and charts of strong names show support, then I’ll get more aggressive.
Until then, the environment is calling for caution.
That doesn’t mean you can’t take trades — it just means you need to be more selective.
That’s why I’m sticking to the 1 strategy that works in 80% of market conditions.*
I’m talking about the same approach I used to turn $50 into $1,260 in just 2 months…*
And I’m about to reveal exactly how YOU can weaponize this strategy during my Simpler Options 2-Day Virtual Bootcamp.
If you’ve been wanting to understand how options really work, now is the time…
The market won’t wait for you to figure this out on your own.

The market won’t wait for you to figure this out on your own.
How To Use The $TICK Today
Don’t just look at price action. Look at what’s happening underneath the surface…
Start using the $TICK to guide your trading decisions.
If the $TICK is telling you the market is selling and you’re looking at a long setup, wait. Choose your “dance song” wisely.
Manage your risk. Use stops. Size your positions appropriately. The $TICK can help you identify favorable conditions, but it doesn’t eliminate risk.
Re-entry is valid. If you exit a trade because the $TICK turned negative, and then the $TICK flips positive again and your setup re-triggers, you can get back in.
Don’t be stubborn. Follow the data.
The $TICK isn’t a crystal ball. It won’t tell you which stock to buy or what strike price to choose.
But it will tell you whether the market environment favors your trade (or fights against it).
And in a choppy, whipsaw market like we’ve been seeing, that information is priceless.
Happy trading,
Ben Sturgill
*Past performance does not indicate future results