Good morning, traders…
I recently wrote about exhaustion patterns — how to spot when selling pressure is running out of steam.
One question kept coming up in my webinars:
“If exhaustion patterns show us when a stock might be done falling … how do we know it’s actually ready to move higher?”
Timing a bounce is one of the hardest parts of trading. Jump in too early, and you’re catching a falling knife. Wait too long, and you miss the move entirely.
The margin for error is razor-thin. But there’s another genre of pattern that can help you time your moves.
Bottoming patterns.
Double, triple, quadruple, or more “bottoms” on the chart show you where buyers are taking control — the exact price level being defended by Smart Money.
These patterns are everywhere in the stock market, but many traders either ignore them (or jump in too soon).
Bottoms take time to form. They require multiple tests of support. The more times a stock bounces off the same level, the stronger that level becomes (and the more explosive the eventual breakout).
I’ve identified five charts right now showing textbook bottoming patterns. Some have tested support twice. Others, three or four times. Another one, 7 times.
If you can start to identify these patterns on your own…
You Can Enter Trades At One Of The Best Risk/Reward Zones In A Chart’s History…
Why Bottoming Patterns Work
Bottoming patterns are a multi-step process.
The stock sells off, finds support, bounces, and then comes back down to test that same support level again.
Each time it bounces off that level without breaking lower, it’s telling you something: buyers are defending this price.
Each time, stronger, with more conviction.
The first bounce? That’s intriguing…
The second bounce? I’m paying attention…
The third, fourth, or fifth bounce? Now I’m actually considering an entry.
Each time the support holds, it weakens the sellers and strengthens the buyers.
By the time you see a triple or quadruple bottom, the sellers are exhausted.
They’ve thrown everything they have at breaking that level, and it’s held.
When the stock finally breaks above resistance, there’s often nobody left to sell—and the move can be fast.
The key is patience. Don’t try to catch the bottom on the first test. Let the pattern develop. Let the stock prove it can hold support multiple times before you commit capital.
5 Examples of Bottoming Patterns
Let me walk you through five real examples from the market right now.
The Long-Term Double Bottom: United Parcel Service Inc. (NYSE: UPS)
This one is wild. UPS tested support around $82 back in 2020, then went on a massive run to over $230.
Fast forward five years, and the stock has come all the way back down and tested that exact same level … to the cent.
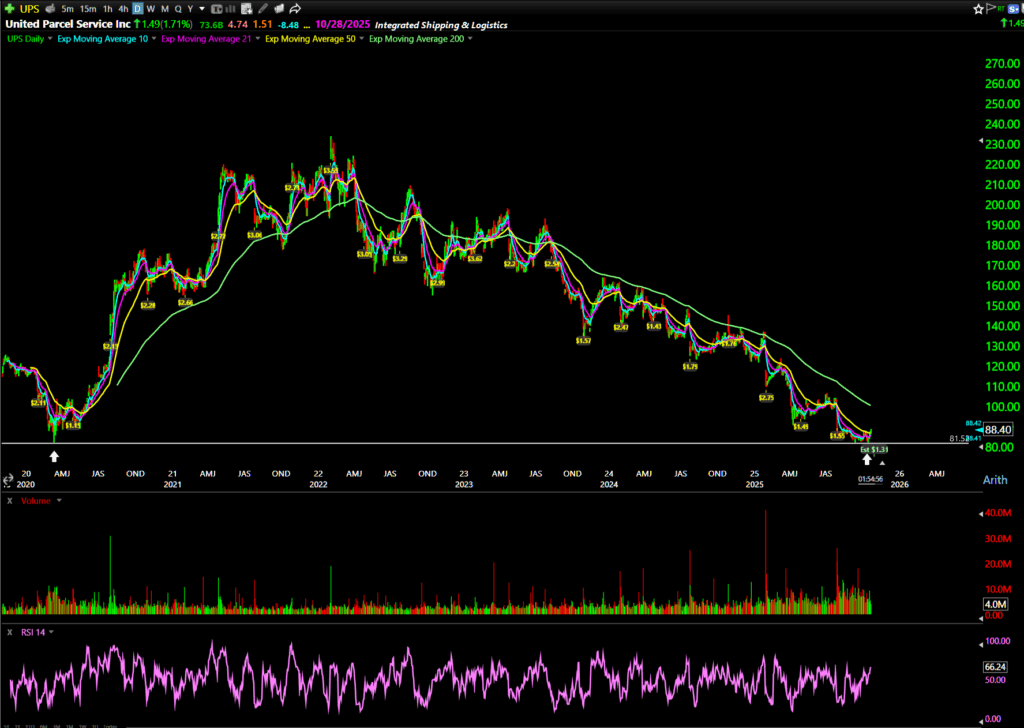
That’s a double bottom with five years between tests…
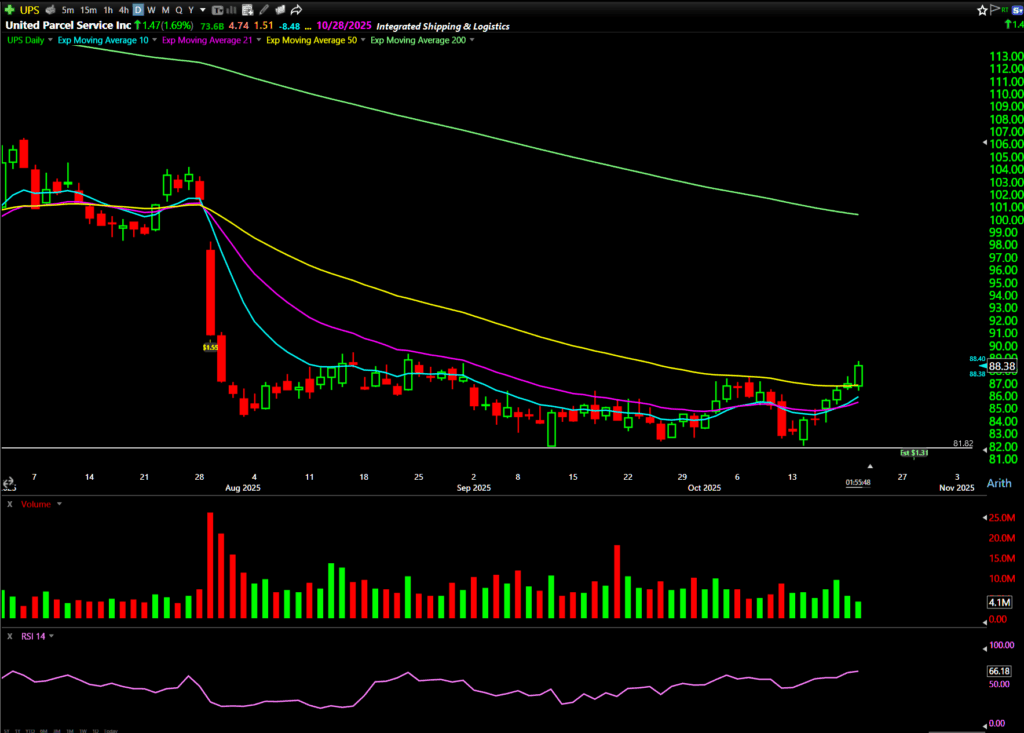
When a stock remembers a support level from half a decade ago and respects it perfectly, that’s telling you something.
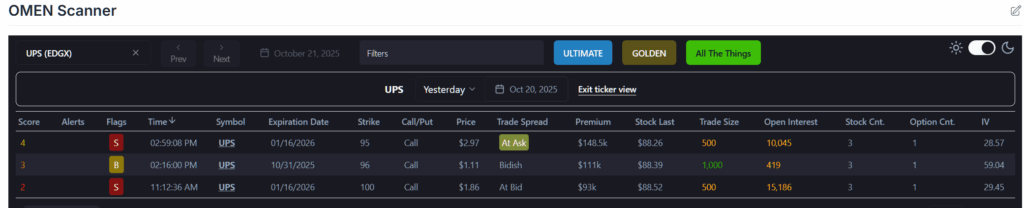
Think it’s a coincidence that Smart Money has been hammering calls every day on my OMEN Scanner?
Think again…
Institutional memory runs deep. The moving averages are starting to flatten out. If UPS can break above $90, that could signal the end of this brutal downtrend (and the start of a new leg higher).
The Quadruple Bottom: Deckers Outdoor Corp. (NYSE: DECK)
DECK has formed a quadruple bottom around $95 throughout 2025. Four distinct tests of that support zone, each time the stock has bounced.
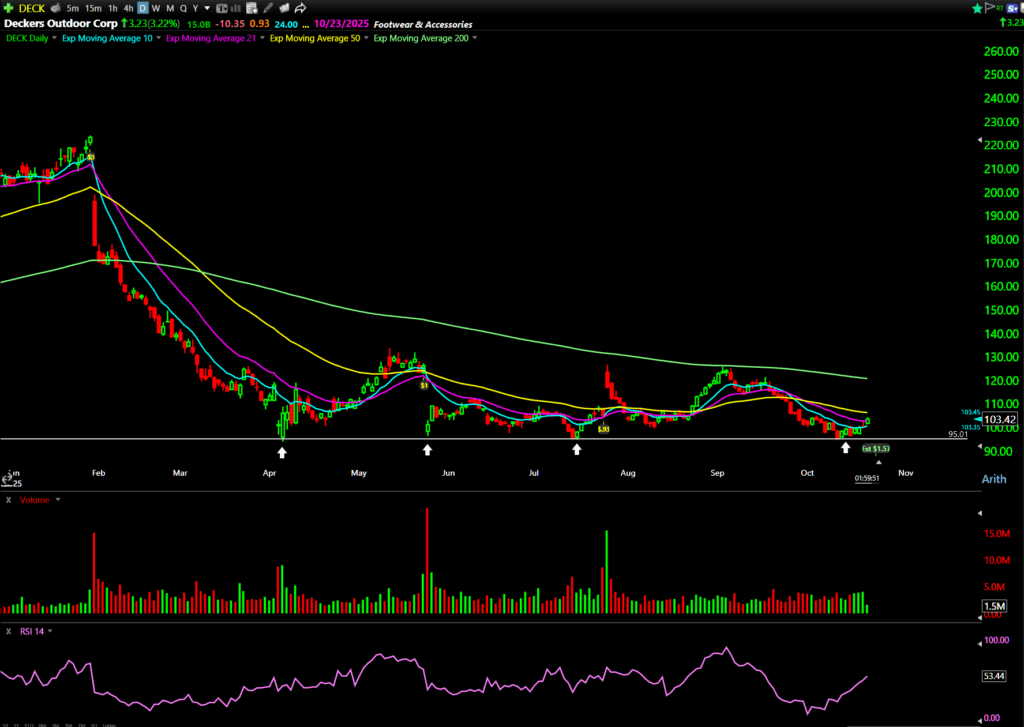
The most recent test in October held beautifully, and now DECK is trying to break above its moving averages.
This is a textbook example of what I look for: multiple tests of support, tightening price action, and converging moving averages.
Another Quadruple Bottom: SoFi Technologies Inc. (NASDAQ: SOFI)
SOFI built a quadruple bottom at $6 throughout 2024.
Four times the stock tested that support level — and four times buyers defended it.
Then, in late 2024, SOFI broke out and hasn’t looked back.
It’s up more than 270% since that quadruple bottom.
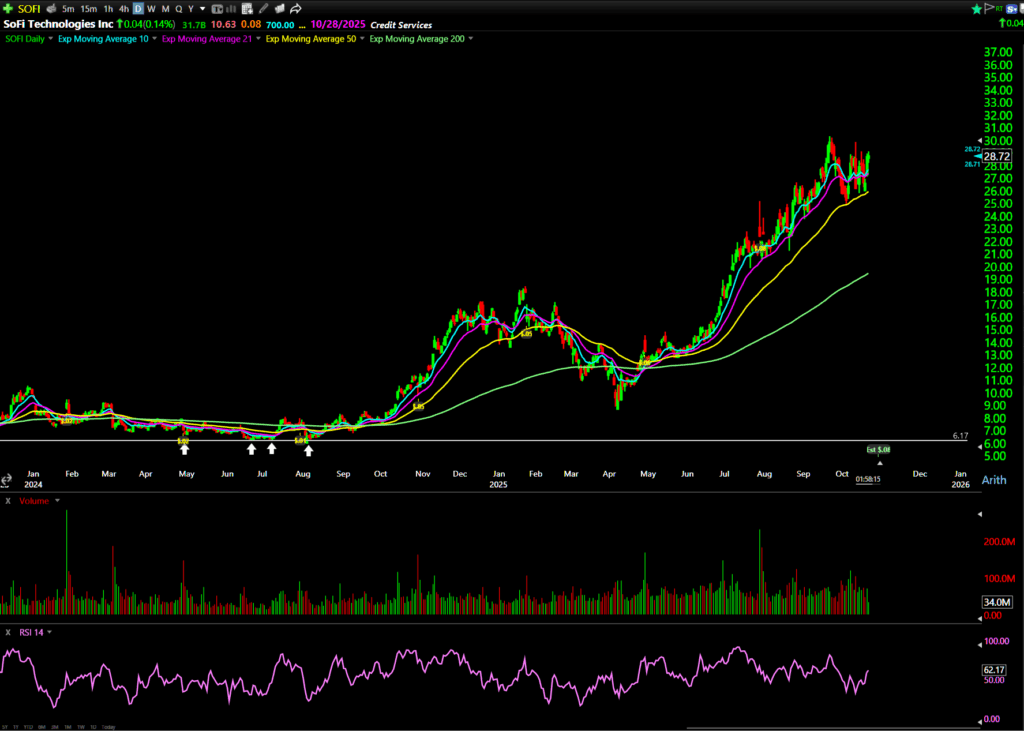
The pattern started with those four bottoms back in 2024.
This chart is a perfect example of why bottoming patterns work.
The stock tested support four times, exhausted the sellers, then exploded higher when it finally broke resistance.
The Septuble Bottom: Moderna Inc. (NASDAQ: MRNA)
MRNA has tested the $23.20 level seven times since February.
Seven.
No, that’s not a typo.
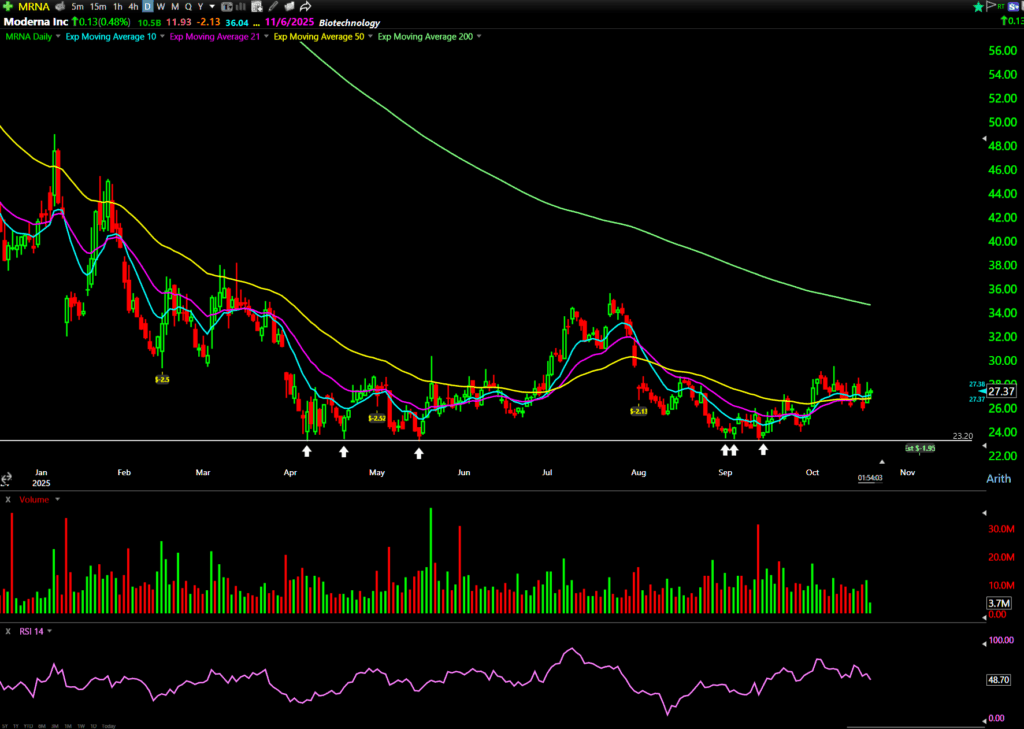
That’s a septuple bottom, and each bounce off that support level has held. The stock briefly dipped below $24 in September, but buyers stepped in aggressively and pushed it right back above support.
Now, MRNA is breaking out just above that level. The pattern is clear: sellers have tried to break this stock lower seven times and failed every single time.
Every time this stock gets to $23, a bounce is imminent.
Why This Matters Now
We’re in a choppy market where stocks are whipsawing traders left and right.
Bottoming patterns give you a visual pathway to time entries with precision.
These patterns work because they reflect real supply and demand dynamics. Each test of support removes weak sellers from the equation.
By the time the stock is ready to break out, there’s often nobody left to sell — and that’s when upside moves can turn into parabolic squeezes.
The five charts I’ve shown you are all at different stages of their bottoming patterns. Some are still testing support. Others are breaking out right now.
Start looking for these patterns as you scan daily and weekly charts.
Don’t make trading more difficult than it needs to be.
Because while most people get crushed trying to compete with Wall Street…
44 traders have used Tim Sykes’ unique formula, trading a hidden corner of the market that gets completely overlooked by mainstream investors.
The same formula that helped Tim turn $12,4000 into $7.9 million in career profits…*
And the same formula these everyday traders weaponized to transform their trading:

On October 21-22, Tim wants to show YOU how his secret trading formula works…
This is your LAST CHANCE to get a seat.
Happy trading,
Ben Sturgill
*Past performance does not indicate future results