
The market is hotter than ever.
Major indexes keep grinding toward fresh all-time highs while everyone argues about whether this rally has legs.
I’m not arguing about the strength of the rally.
I’m trading it.
Every day, we take what the market gives us, and we roll with the punches…

Right now, the market is red hot.
I’m not sitting by because people are nervous about a pullback. I’m right in the fray, throwing punches and ducking fists…
For example, on May 27, I saw a textbook trade setup forming on a major index. This pattern repeats every few days.
Once you know what to look for on the chart, you can stop guessing which index to play and start looking for the ones that already told us to get in.
Four Charts, One Tell
On May 27, I was watching four major index futures:
- The S&P 500 future (/es)
- The Nasdaq 100 future (/nq)
- The Dow future (/ym)
- The Russell 2000 future (/rty)
Futures trade nearly around the clock. As a result, the chart shows me what happened overnight and before the U.S. cash open.
That extra context matters.
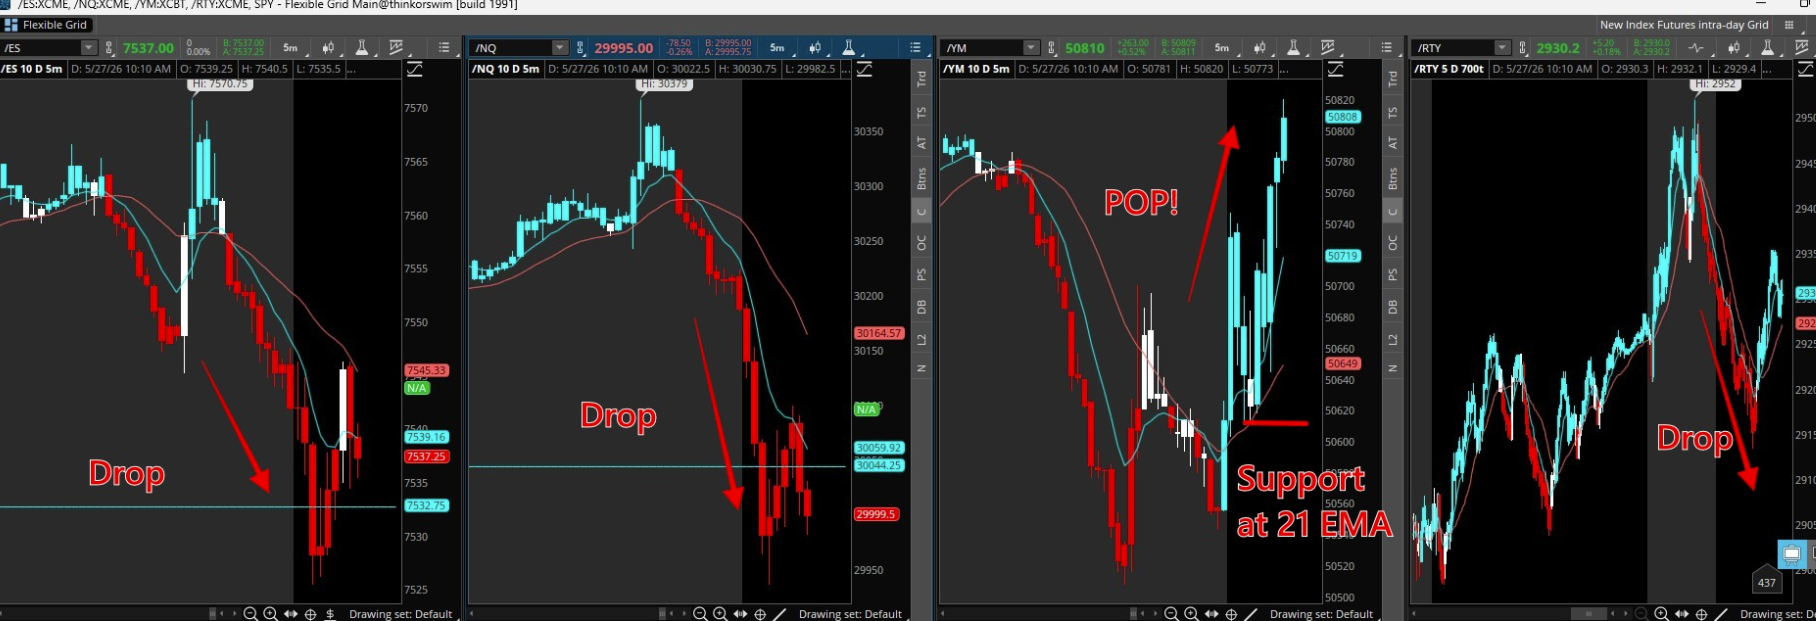
This morning, three of the four indexes flushed lower right out of the gate.
If you stopped scanning there, you’d think the whole tape was weak and either sit on your hands or bet on more downside…
That’s a trap.
The One Index That Refused To Drop
The Dow futures did the opposite…
The chart opened strong intraday. Then it pulled back in the first few minutes and based at the 21 EMA.
Nobody knows for sure whether the price will bounce off the 21 EMA… but it’s a good place to buy, seeing as it can act as our risk level and show us a lot of good support.
Sure enough, the Dow futures bounced higher from that level. It was a perfect rally off the 21 EMA support.
While the other three were busy making new lows, Dow futures were making new intraday highs.
The 21 EMA on the charts below is the red/pink line:
When the broader tape is selling, and one index refuses to participate, it’s a sign that the index isn’t just “holding up”…
Smart money is buying it.
Our job as traders is to follow that money, not argue with it.
Beyond The Indexes
Here’s the part traders miss…
This pattern can work on individual stocks, ETFs, and any liquid asset that prints a clean chart.
The recipe is the same every time.
Identify a strong trend, or a trend that breaks from what the rest of the tape is doing. When the market is selling, and one name is grinding higher, that’s a tell.
Then I look for support in two places. Past price action is the first place:
- Old breakout levels
- Prior consolidation zones
- The morning high from a previous session
Remember, other traders are watching these levels too.
The second place I look is the EMAs.
The 21 EMA on the 5-minute chart works really well for intraday trades. You can use higher timeframes for swing trades.
When the price pulls back to one of these areas and bases instead of breaking lower, that’s my sign to buy calls.
From there, the trade plan writes itself.
Trade Plan Specifics
Keep the stop loss tight. The whole reason I take a setup at support is so my risk is defined and small.
If price slices through the 21 EMA and through the prior price level, the setup is broken. I get out. No second-guessing.
As the chart is setting up, trust the support and its ability to rally. The whole point of waiting for the pullback is that the support level gives me a high-probability launch pad. If I picked the right level, it bounces with conviction.
Lastly, take gains into strength. When prices push back through the morning high or the prior resistance, that’s where I’m peeling off contracts. Selling into green candles is how I keep the gains I just made.
This is a perfect strategy for anyone looking to identify a trend on a stock or an asset and ride that trend for intraday gains.
Patient people take money from impatient people…
- Exercise enough patience to build a solid trade plan.
- Wait for your area to buy.
- And keep your expectations realistic for gains.
Let’s get after it.
Be good (and be good to others),
Ben Sturgill
*Past performance does not indicate future results. Not typical.