Good morning, traders…
As soon as the opening bell rang yesterday morning, the market was seeing red.
By mid-morning, the S&P 500 was down more than 2%, driven lower by an -11% post-earnings move from Microsoft Corp. (NASDAQ: MSFT).
As usual, traders were freaking out, selling positions, and doing exactly what they shouldn’t.
But I’ve been through enough red days to know that without major structural damage, the selloff is usually short-lived.
A bounce is almost always imminent.
You don’t have to go far back into market history to see it.
Remember last Tuesday?
On days like these, when fear is running high and red candles are stacking up, I don’t panic.
I hunt for pullback opportunities.
I’m looking for strong names pulling back to key support levels. And I’m checking which stocks are holding their structure (despite the broader weakness).
That’s exactly what I did yesterday morning. While the S&P 500 was showing extreme oversold readings on the hourly chart, I was zeroing in on two specific setups.
Both were at critical support levels, with clearly defined stops, offering asymmetric risk-reward if the bounce materialized.
Sure enough, it did.
Seventeen minutes after entering the first trade, I was already locking in gains. Nine minutes after entering the second, I was scaling out more profits.
Here’s How I Found 2 Amazing Pullback Setups (While The Market Lost Its Mind)…
INTC Feb 20 $50 Calls
The first chart I zeroed in on was Intel Corp. (NASDAQ: INTC).
I’ve been calling this name out for weeks now.
My thesis: The U.S. government took a 10% stake in the company. Trump wants this stock to go up. It’s that simple.
But the stock had been extended. I was waiting for a pullback, and I got it on January 23. The selling pressure finally brought INTC down to a level where I could start considering an entry.
From there, I waited to see a base form, buyers step in, and a clear entry level present itself. I wasn’t going to rush in just because the stock was cheaper than it had been. I needed to see support hold, buyers show up, and confirmation that the momentum remained.
I got those boxes checked yesterday on the pullback to $47.50. The level held and volume came in. The base was forming exactly how I wanted to see it:
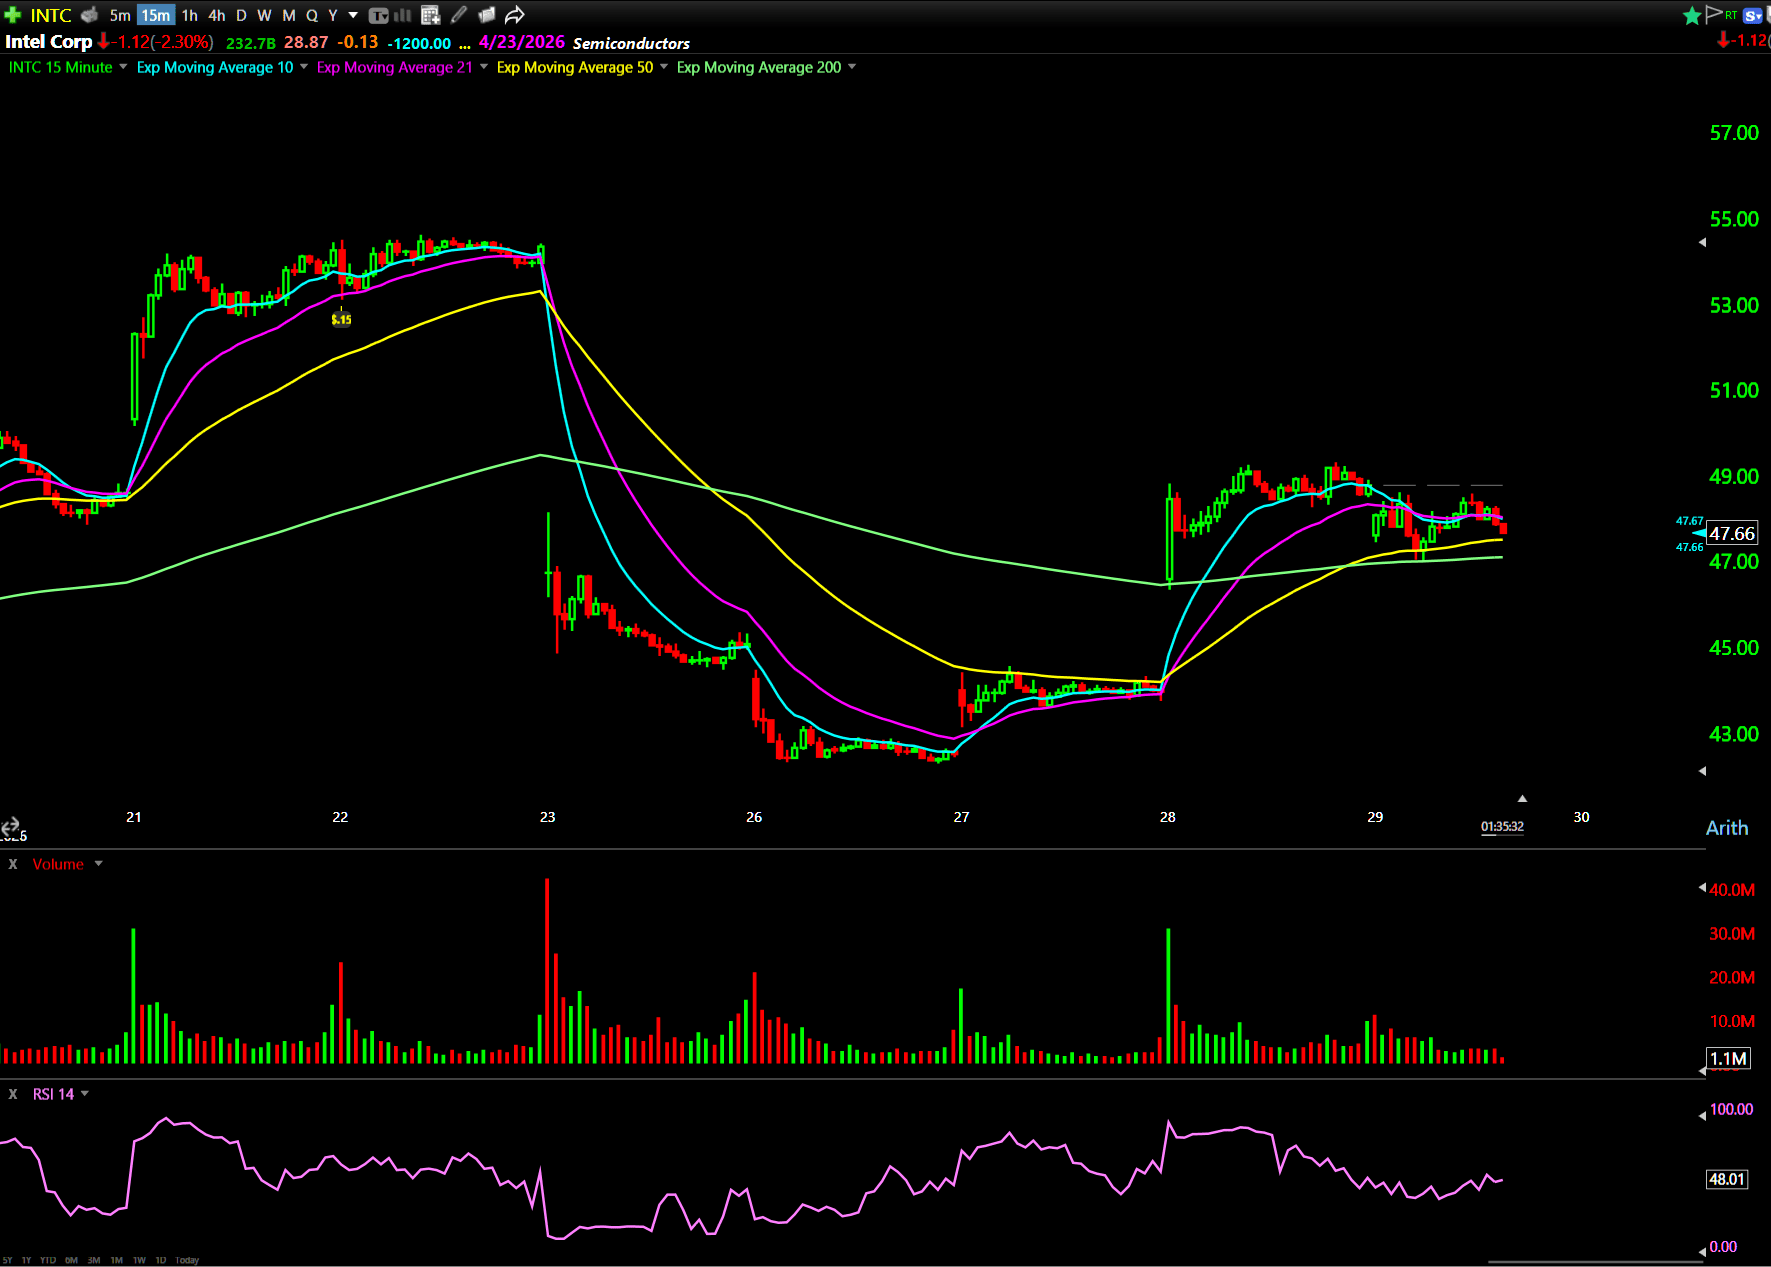
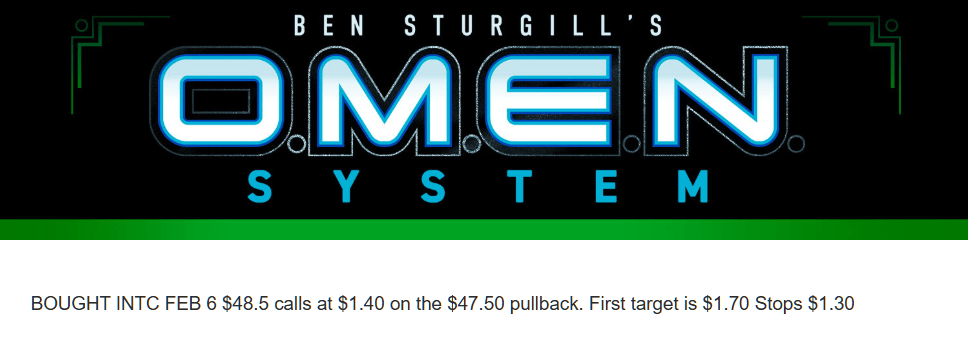
So I entered the Feb 20 $50 Calls:
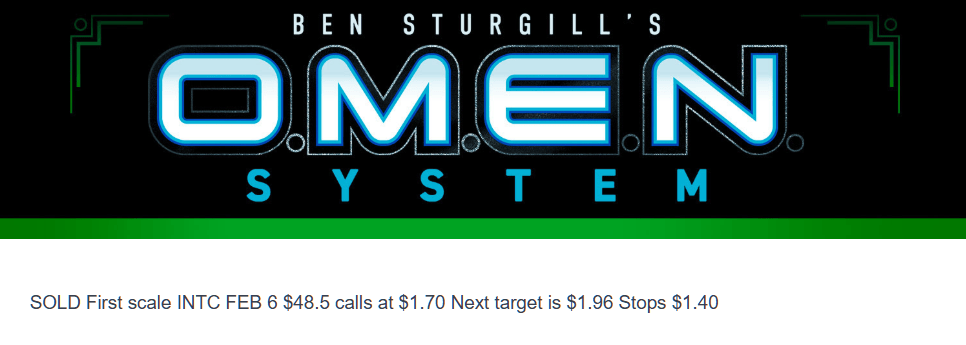
Just 17 minutes later, I was already locking up gains:
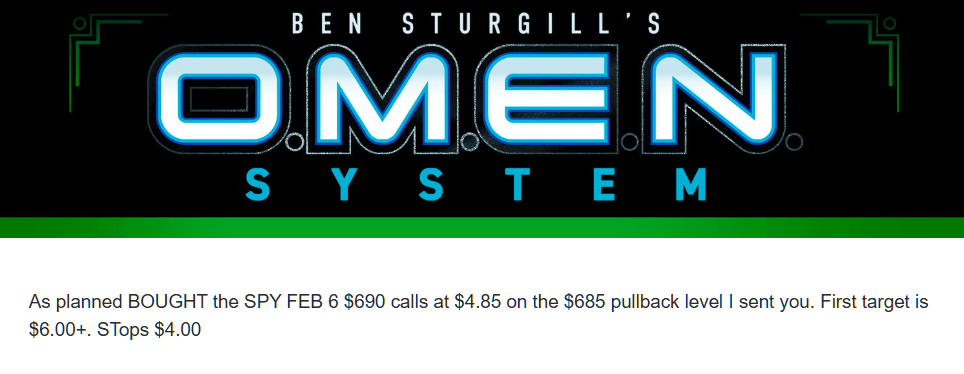
SPY Feb 6 $690 Calls
While INTC was setting up, I was also watching the broader market.
And what I saw told me a bounce was coming.
SPY was at a negative 5.5 average true range (ATR) on the hourly chart. That’s extremely rare.
A -5.5 ATR reading means the market had moved 5.5x further than its normal hourly range below a key reference point.
That told me three things:
Sellers had likely already spent a lot of money pushing the market down this far.
Every additional point lower required more force than the last. Risk-reward for new shorts was worsening rapidly. Anyone shorting at this level was late to the party.
At that level, markets do one of three things:
Mean reversion bounce (the most common outcome). Price snaps back toward VWAP, the prior value area, or the 1-2 ATR zone. This is what happens when stretched conditions normalize.
Volatility compression. Price chops sideways while ATR catches up to the move. The market goes nowhere for a while as it digests the violent move.
Panic continuation lower (the least common outcome). This only happens if there’s a major macro shock, forced liquidation, or a complete no-bid environment where sellers overwhelm any available buyers.
Knowing a mean reversion bounce was the most probable outcome, the question was: Where will it bounce?
This is when knowing your key price levels matters more than anything.
A few weeks back, I identified four crucial levels that could make or break SPY.
$685 as the decision zone, what I call the point of control.
$689 as major resistance, the level the market needs to break and hold above to unlock upside momentum.
$678 as “The Alamo,” the level that must be defended at all costs.
$675 as the invalidation point, the level that calls for full defensive posture, all cash and puts as hedges, no questions asked.
Look where SPY bottomed out yesterday:
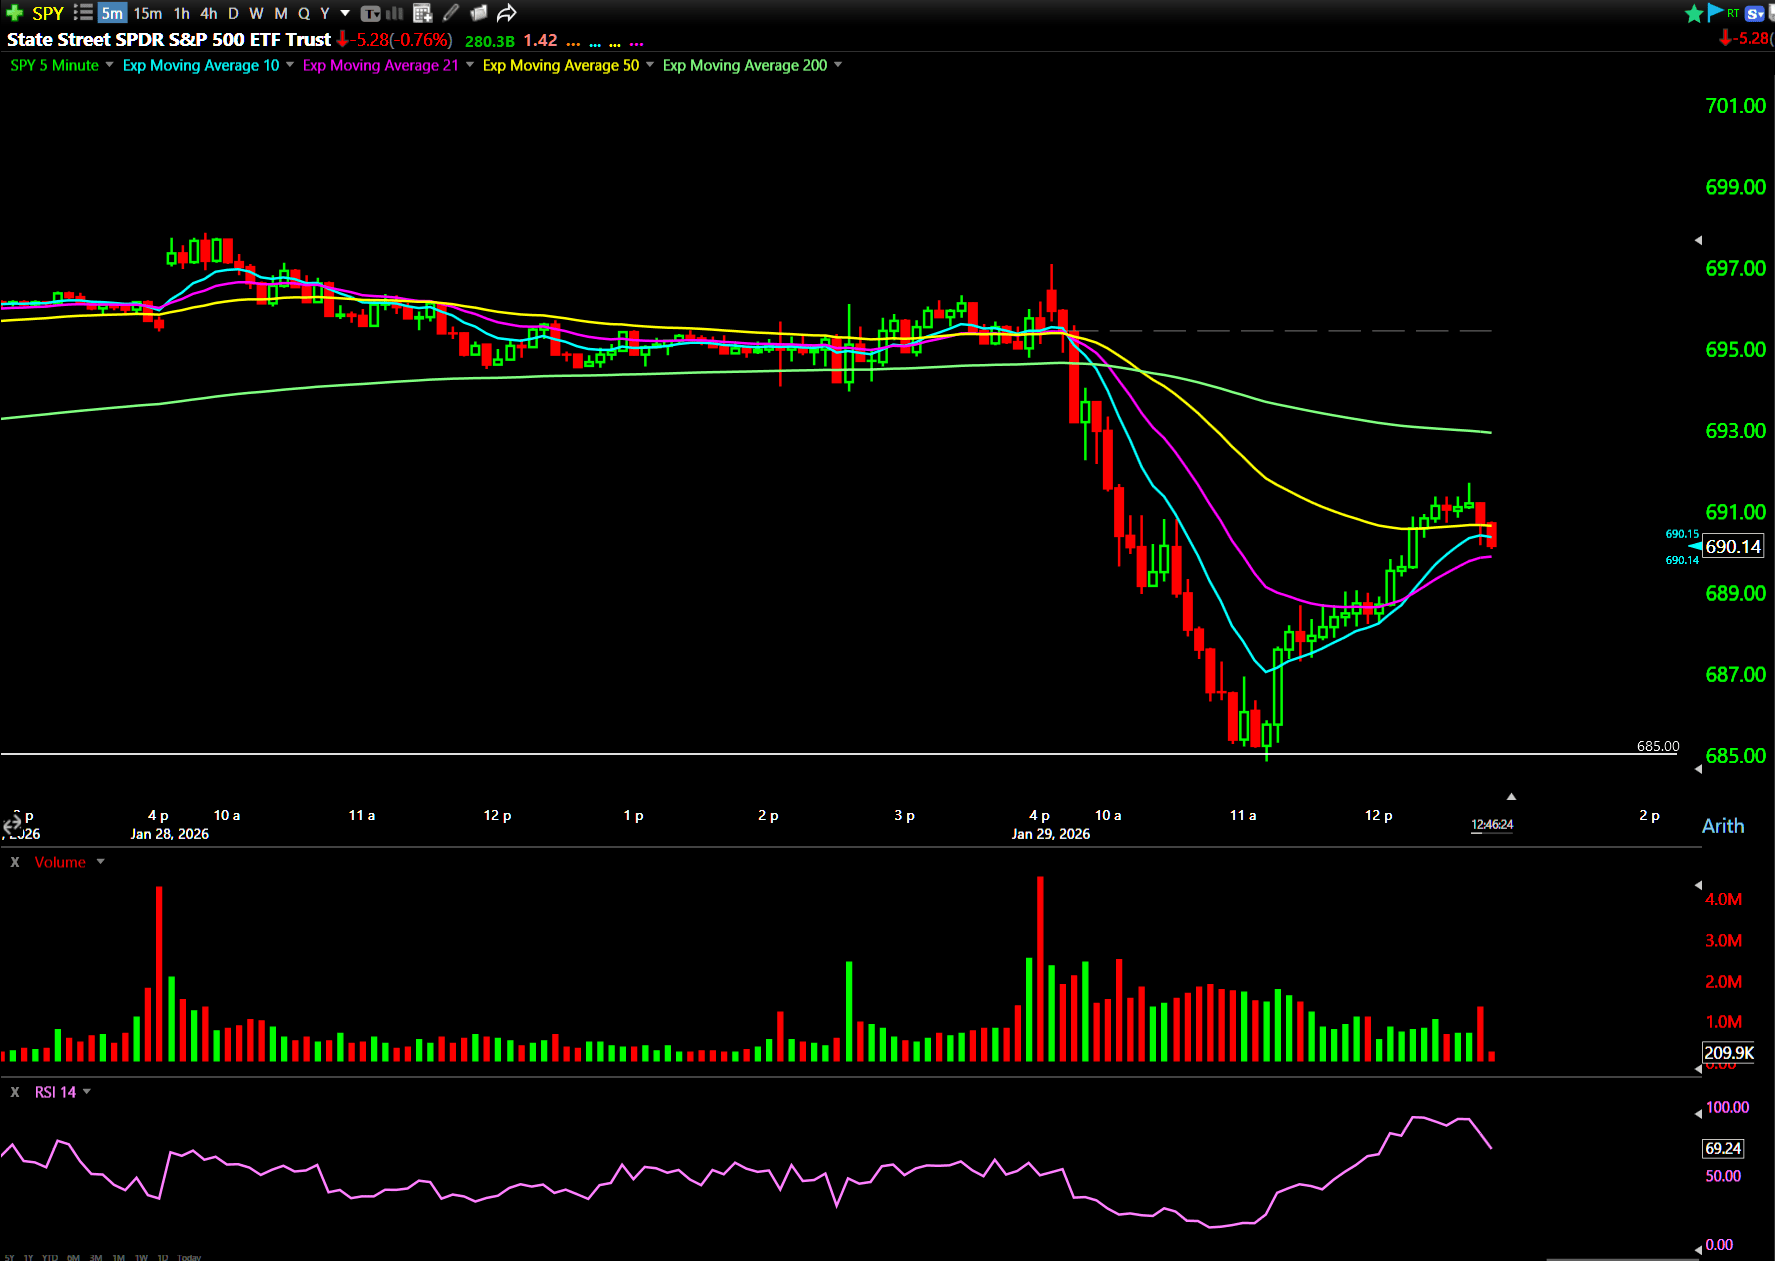
Exactly at $685, the point of control.
This wasn’t a coincidence. When SPY hit $685, I knew exactly what my plan was because I’d done the work beforehand.
I bought SPY Feb 6 $690 Calls with a 20% stop-loss, positioning for a snapback into next week:
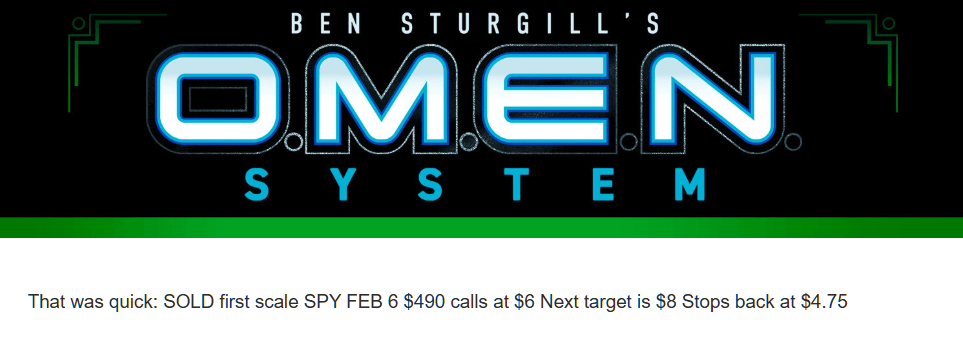
Just 9 minutes later, SPY had already bounced off $685, and I was already scaling out of my first batch of gains:
What These Trades Have In Common
Both of these trades worked for the same reason.
They were simple pullback setups at known support levels.
This is what I’ve been talking about all year with my 2026 pullback philosophy.
I’m done buying breakouts that are already extended.
I’m waiting for quality names to pull back to support, and building positions when they hold.
Why pullbacks? Because they give you a clear line in the sand.
If it breaks below the pullback level, the setup has failed, and you exit.
If it holds, you’ve got upside potential with extremely limited downside risk.
That’s what happened with both INTC and SPY yesterday.
I’m still in both positions. INTC is holding above my entry and working toward resistance. SPY is holding the $689 level I identified weeks ago as the key to unlocking upside momentum.
If it breaks and holds, I’ve got room to run. If it fails, I’ve already locked in partial profits, and my stops are protecting me.
Next time the market opens deep red, don’t fear.
Look for great pullback setups.
Happy trading,
Ben Sturgill
*Past performance does not indicate future results