

Say goodbye to trade alerts… You don’t need them.
Say goodbye to hot picks from social media… You don’t want them.
Say hello to self-sufficient trading… It’s what you deserve.
There’s one trade strategy I use repeatedly. And you can use it too.
Remember the saying, “give a man a fish, and he eats for a day. But teach a man to fish and he eats for a lifetime.”
Friends, I’m here to teach you how to fish.
And once you learn my strategy, you can reapply it, over and over again, for a lifetime of trading gains.
Climb aboard. We’re going fishing.

The “Swing High Pullback Bounce”
This is a bullish trade setup that takes advantage of a stock turning from a downtrend to an uptrend.
Our job is to get in on the ground floor and ride the switch in momentum higher.
Here’s how it works, in 6 simple steps:
1. You have a down trend where the moving averages are stacked negatively: 8<21<34.
2. We see the price move above the 34 moving average and then break above the previous swing high.
3. Then the price pulls back to that previous swing high (not always but often during this time the moving averages start organizing in a bullish way: 8>21>34)
4. ENTRY: Our entry is when the price pulls back to this previous swing high.
5. STOP: Below the bottom of the swing high candle.
6. TARGET: The new swing high.
I know, it can be a lot to take in.
But what kind of a teacher would I be without an example…?
Trade Example
Earlier this year, Advanced Micro Devices, Inc. (NASDAQ: AMD) was in a downtrend alongside the rest of the AI/tech sector.
But in early September the momentum switched and it ran to new all-time highs.

Short dated calls on this stock would have paid out BIG.
But how do we take advantage of this momentum?
Look at the chart again with the moving averages included and some helpful notes that I added…
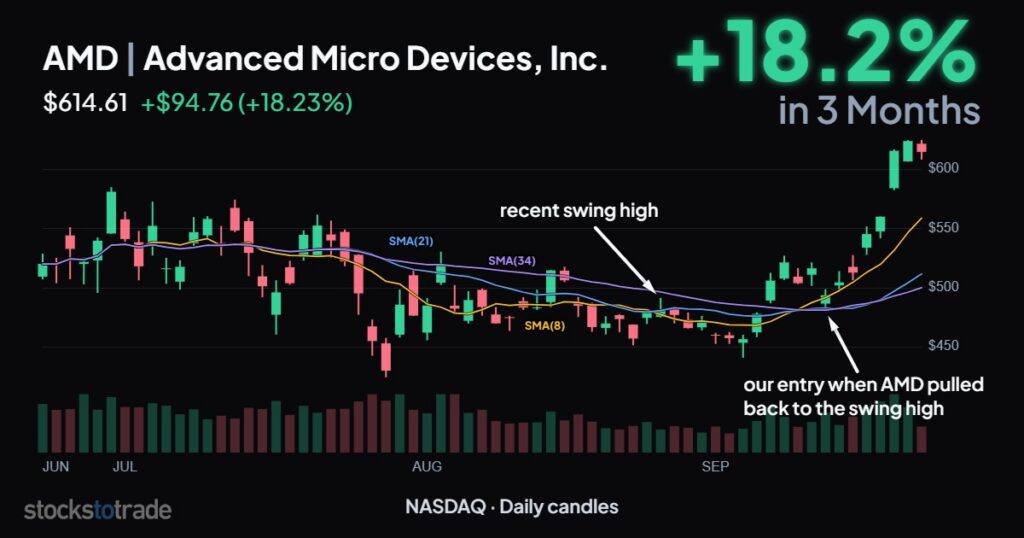
One of the most difficult parts for new traders is identifying the recent “swing high”.
AMD traded higher than the “swing high” that I noted just a few weeks earlier. I can see how people would find that confusing.
Here’s my solution: Practice drawing the ebb and flow of a stock’s daily chart with a single line. Almost like turning your candle chart into a line chart.
The small spike in late August becomes more apparent when we’re only worried about daily averages, instead of the four data points we get from candles (high, low, open, close).
Candle charts are still better from a trading perspective. But sometimes it’s best to simplify parts of our data to ensure we don’t get distracted while planning a trade.
This pattern appears over and over again in the market.
Build a scan that identifies stocks in a downtrend based on the moving averages.
Then wait for the momentum to switch.
Be good (and be good to others),
Ben Sturgill
*Past performance does not indicate future results. Not typical.