Good morning, traders…
Many market participants are afraid of trading options.
They think doing so requires hours of screen time, complex statistical analysis, and constant market monitoring.
They’re wrong.
In my Options Income Trader service, we flip that idea on its head.
This approach proves you can identify high-probability setups using one simple pattern recognition system — even if you’re juggling a full-time job, family responsibilities, or other commitments.
The strategy focuses on learning to recognize repeatable patterns that consistently produce results: clean breakouts, textbook pullbacks, and continuation setups that unfold over days, not minutes.
And the best part is, these patterns work in any market condition…
Bull markets, bear markets, sideways chop. Quality setups emerge regardless of the broader environment.
While other traders chase momentum and overcomplicate their analysis, Options Income Trader focuses on simple, time-tested patterns that have worked for decades.
No complex indicators. No overwhelming watchlists. Just pattern recognition that you can apply consistently.
This week, seven clean patterns have emerged across different sectors, each offering the kind of risk-defined opportunity that busy traders need.
Some are breakout plays. Others are pullback entries. All represent the systematic approach that makes this strategy so effective.
Here Are 7 Swing Trade Setups That Show How Simple Pattern Recognition Beats Constant Chart Babysitting…
Setup #1: Amazon.com Inc. (NASDAQ: AMZN) — Holding VWAP With Authority
AMZN held VWAP on the 5-minute chart yesterday. Why does that matter?
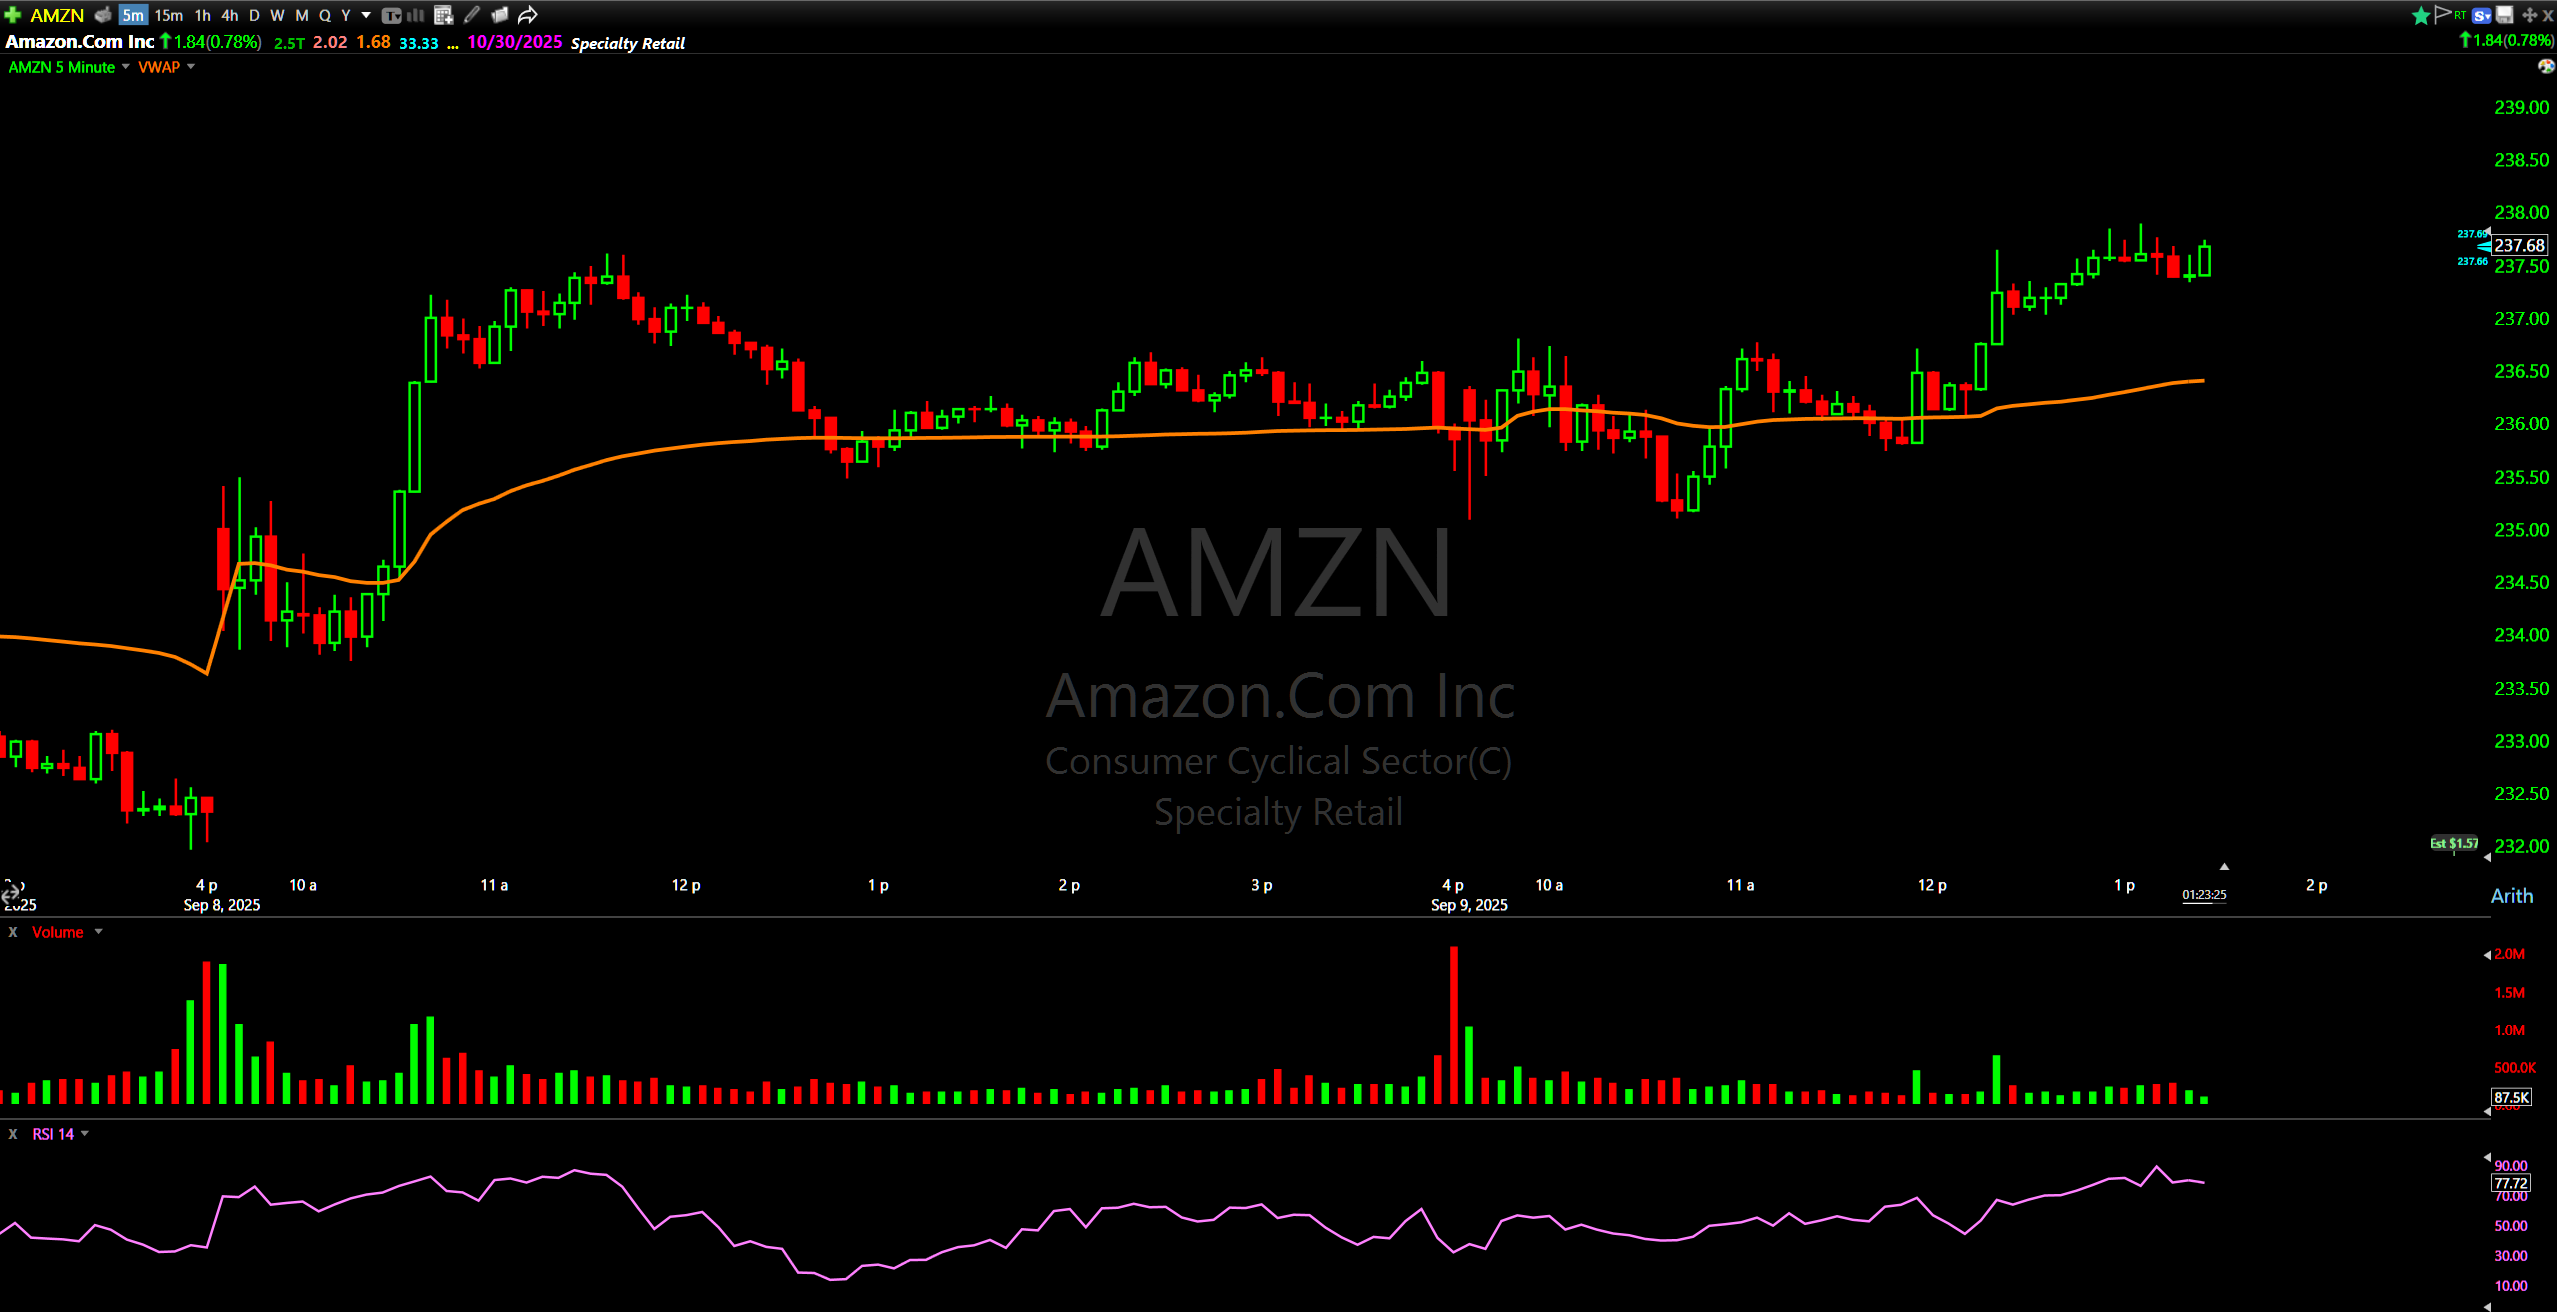
VWAP (Volume Weighted Average Price) shows you where the majority of volume has traded intraday. When the price stays above it consistently, buyers are controlling the price action.
AMZN didn’t just touch VWAP and bounce — it camped above that level, consolidated cleanly, and held those gains into the close.
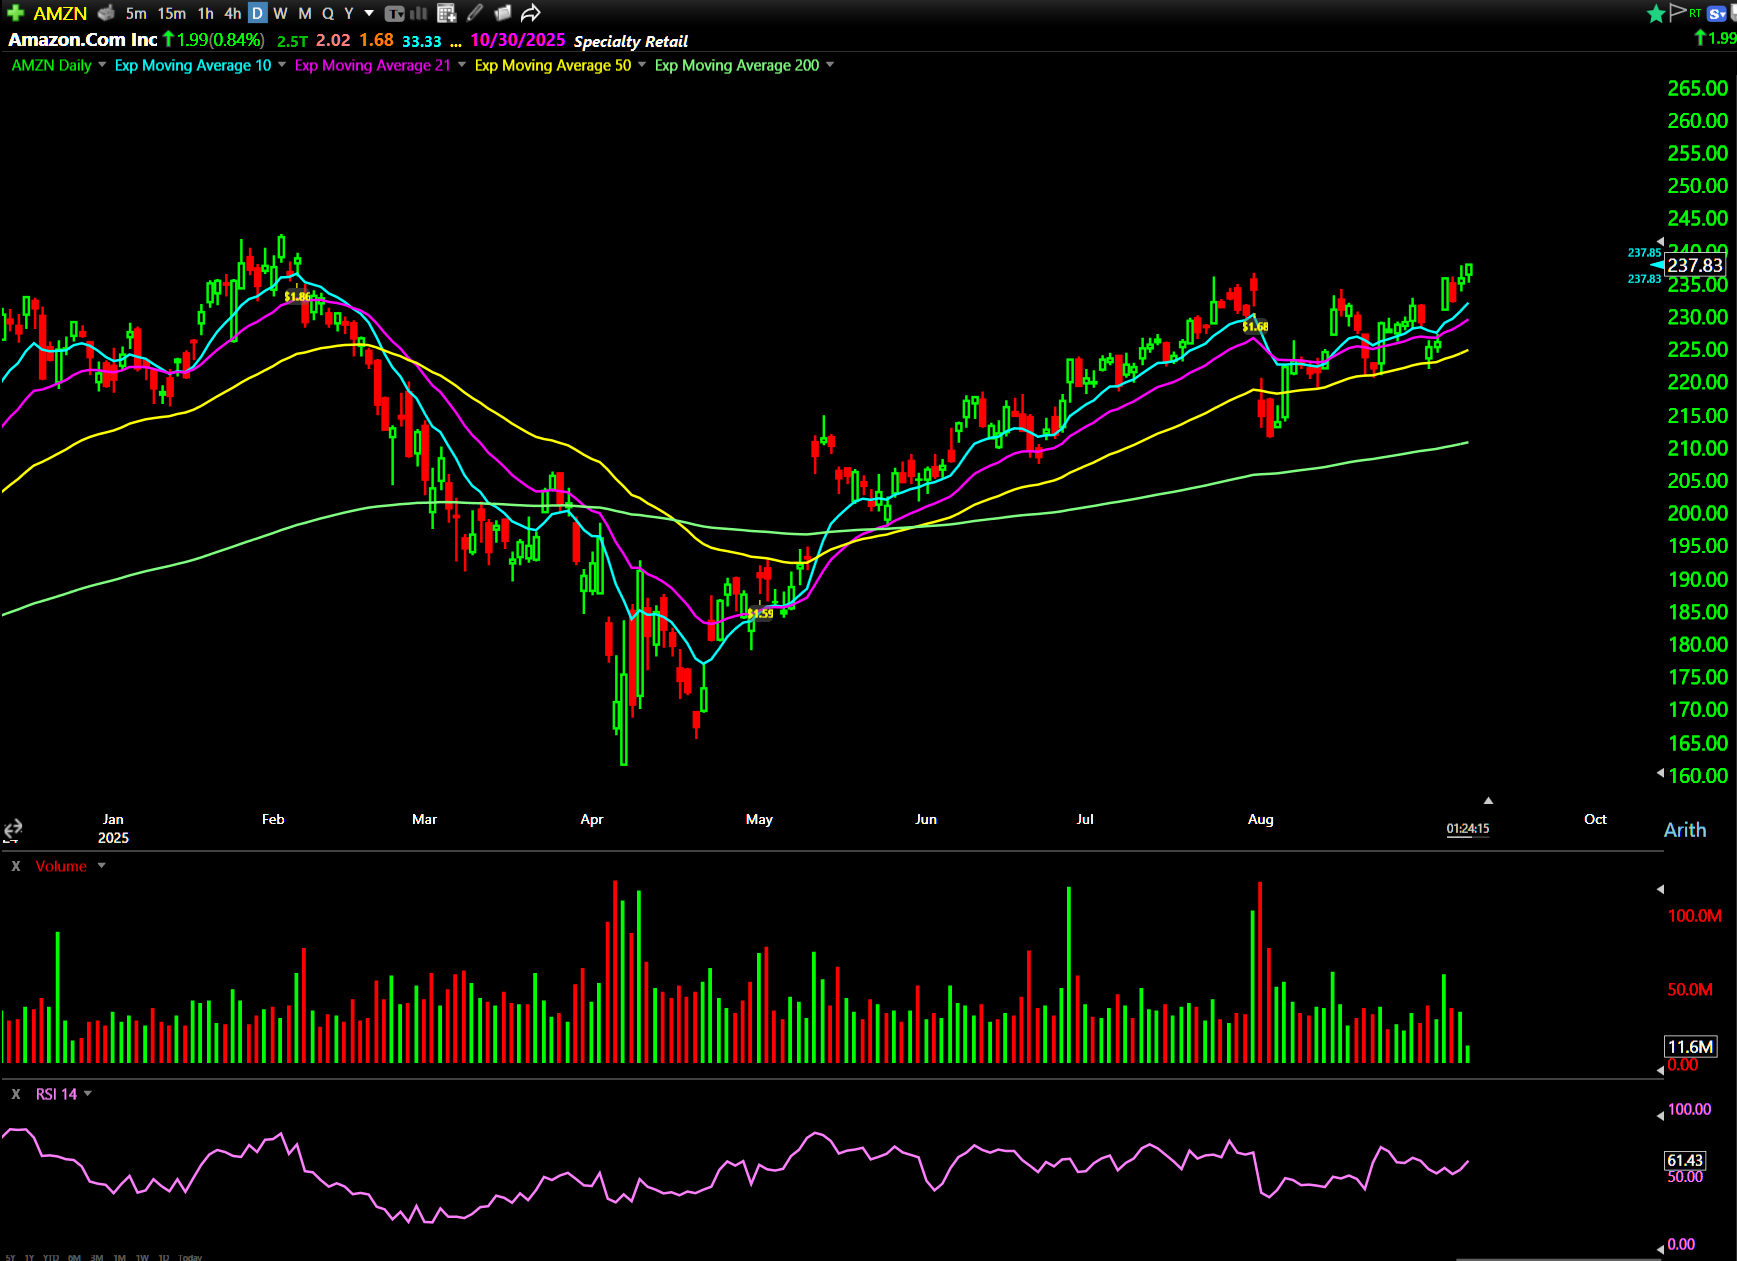
That’s textbook intraday strength.Looking at the daily chart, AMZN has room to stretch toward the all-time high near $242. If the broader market cooperates, this could be one of the first names to break out:
Setup #2: Micron Technology Inc. (NASDAQ: MU) — Smart Money Accumulation
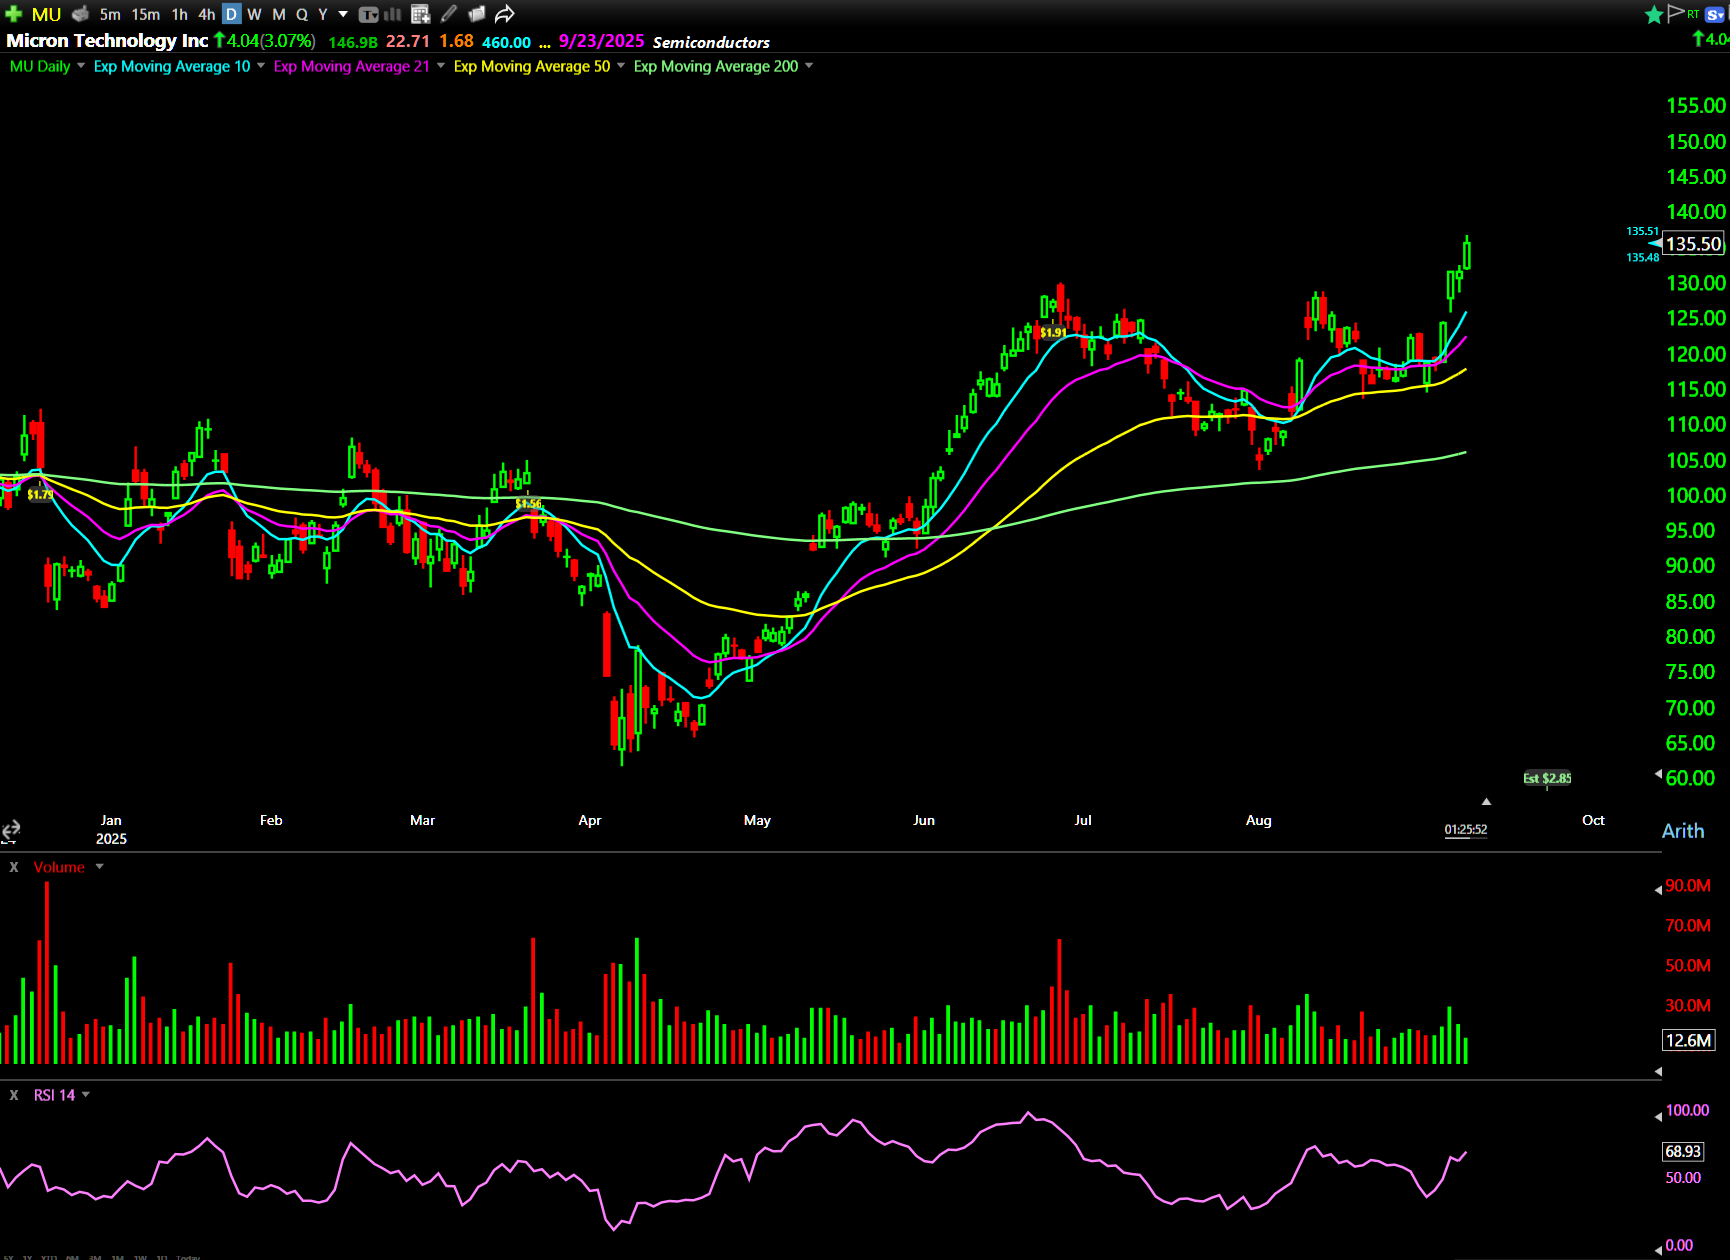
MU showed clear signs of institutional accumulation today. Multiple large block orders hit the tape, and the price responded immediately with strength.
The chart is pushing toward 52-week highs, and the daily pattern mirrors what we recently saw with Taiwan Semiconductor Manufacturing Company Limited (NYSE: TSM). Even though MU didn’t trigger alerts on our OIT scanner, the flow and price action tell the story.
I’m watching the $135 Calls for next week if this continues. Set your risk near the $130 level and let the Smart Money do the work.
Setup #3: Lyft Inc. (NASDAQ: LYFT) — Breakout With Volume
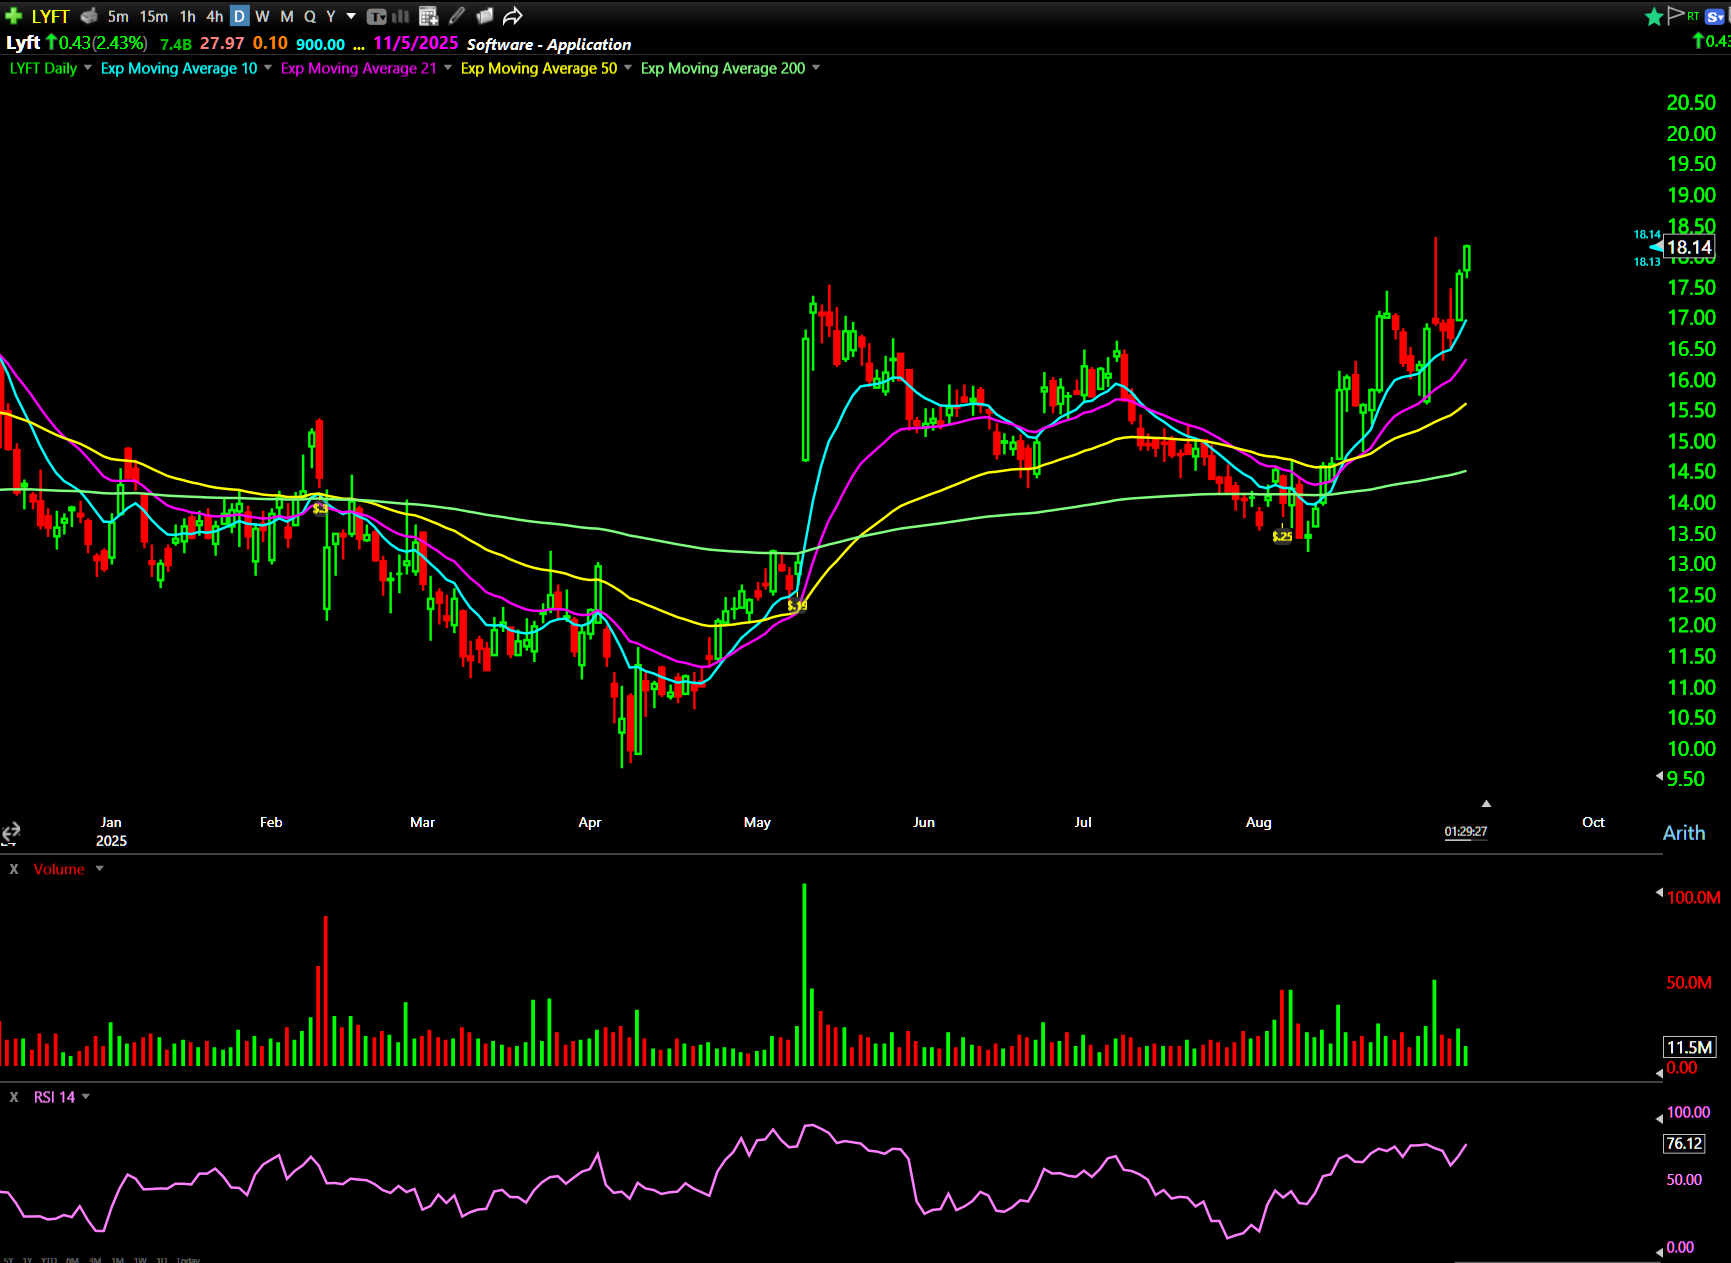
LYFT broke out on legitimate volume and held the entire move. Buyers stayed engaged all session and the stock never surrendered its gains. That demonstrates real Smart Money conviction.
Now it’s setting up a potential VWAP bounce opportunity. After sharp moves, quality names often pull back to VWAP, find support, and continue higher.
If LYFT retraces to that level and holds, it could offer a second-chance entry for those who missed the initial break.
Setup #4: Mobileye Global Inc. (NASDAQ: MBLY) — Bull Flag Formation
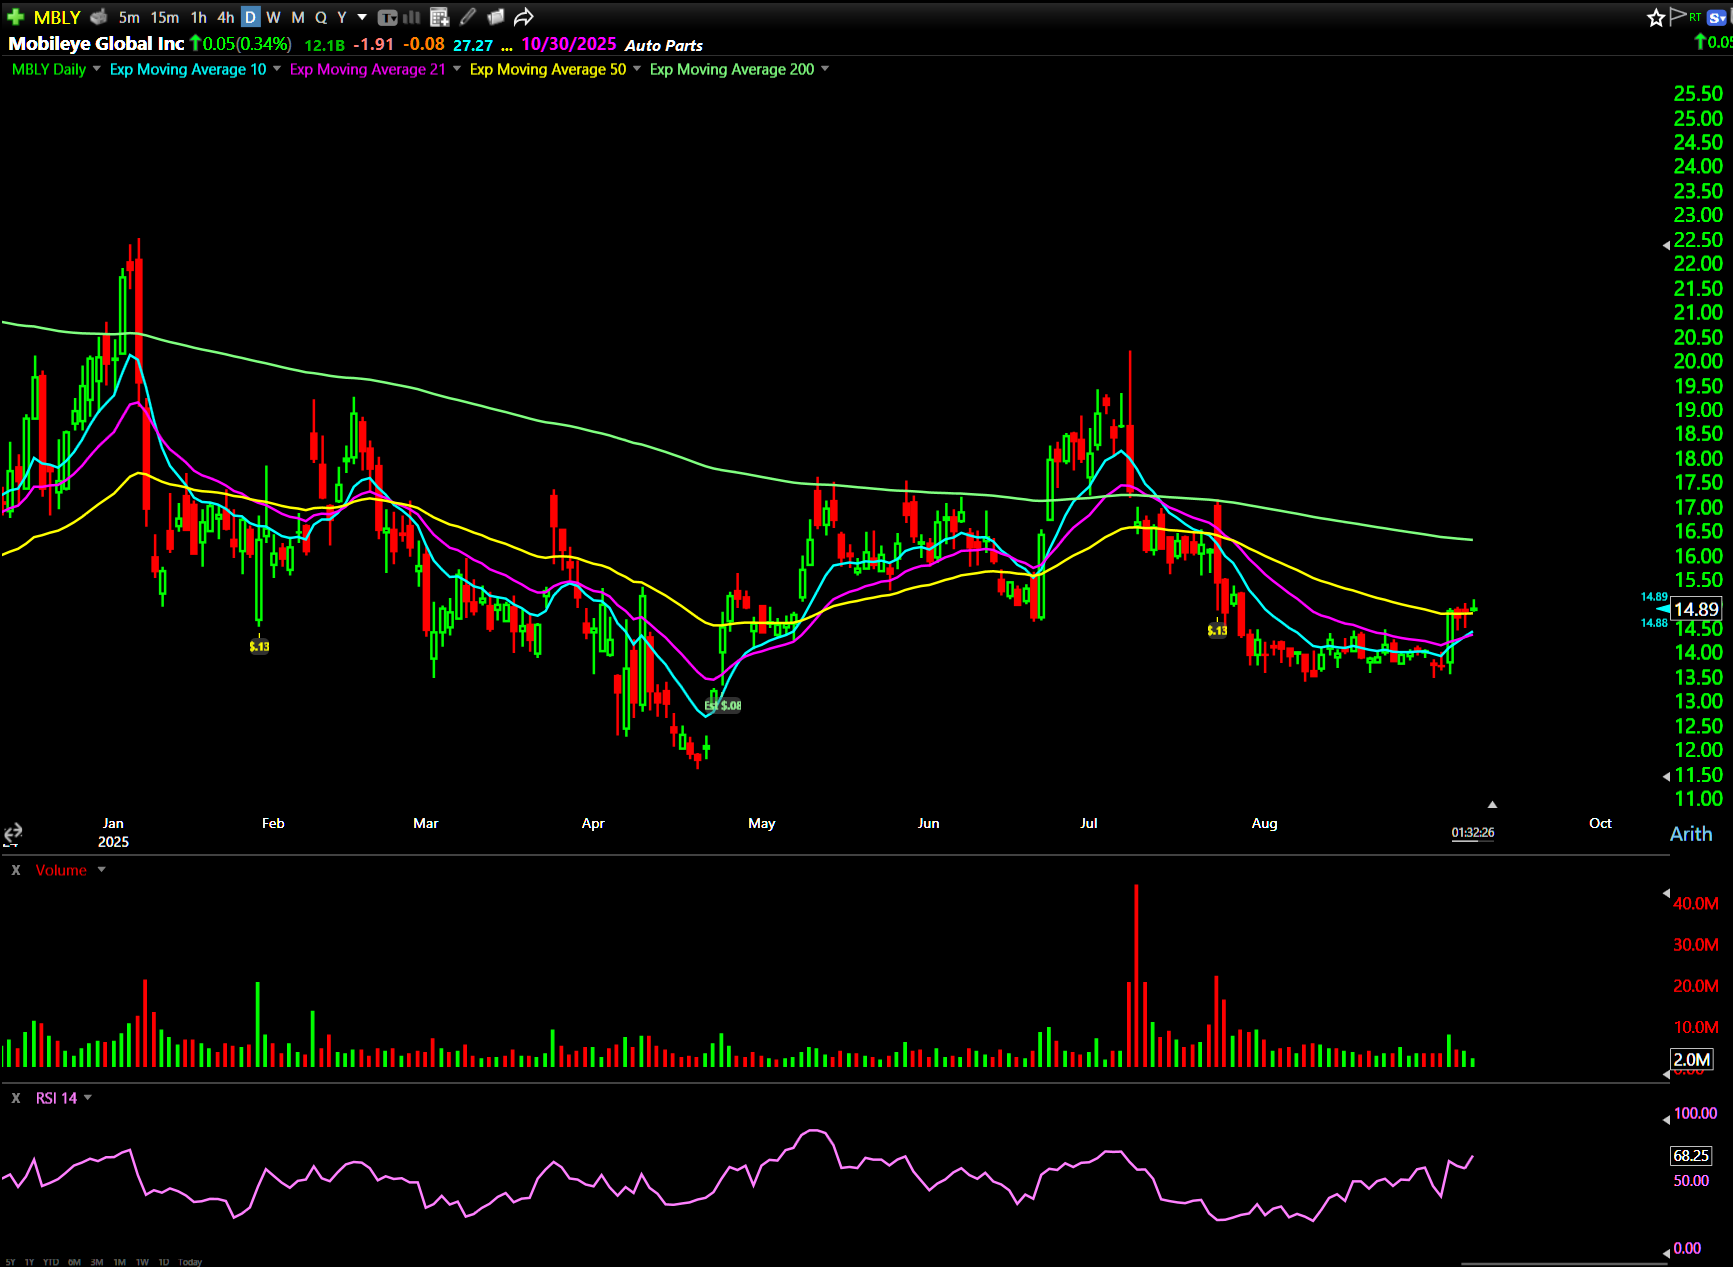
MBLY is building a textbook bull flag. The stock had a sharp move higher last week, and the price is consolidating in a tight range. This is a classic continuation pattern: buyers push it up, pause to digest gains, then resume the move.
The flag is holding just under $15. If volume returns and clears that level, MBLY could move quickly. It’s a speculative setup … size your trades accordingly.
That said, the pattern is legitimate, and these formations often produce strong moves when they resolve.
Setup #5: UiPath Inc. (NYSE: PATH) — Earnings Reversal Pattern
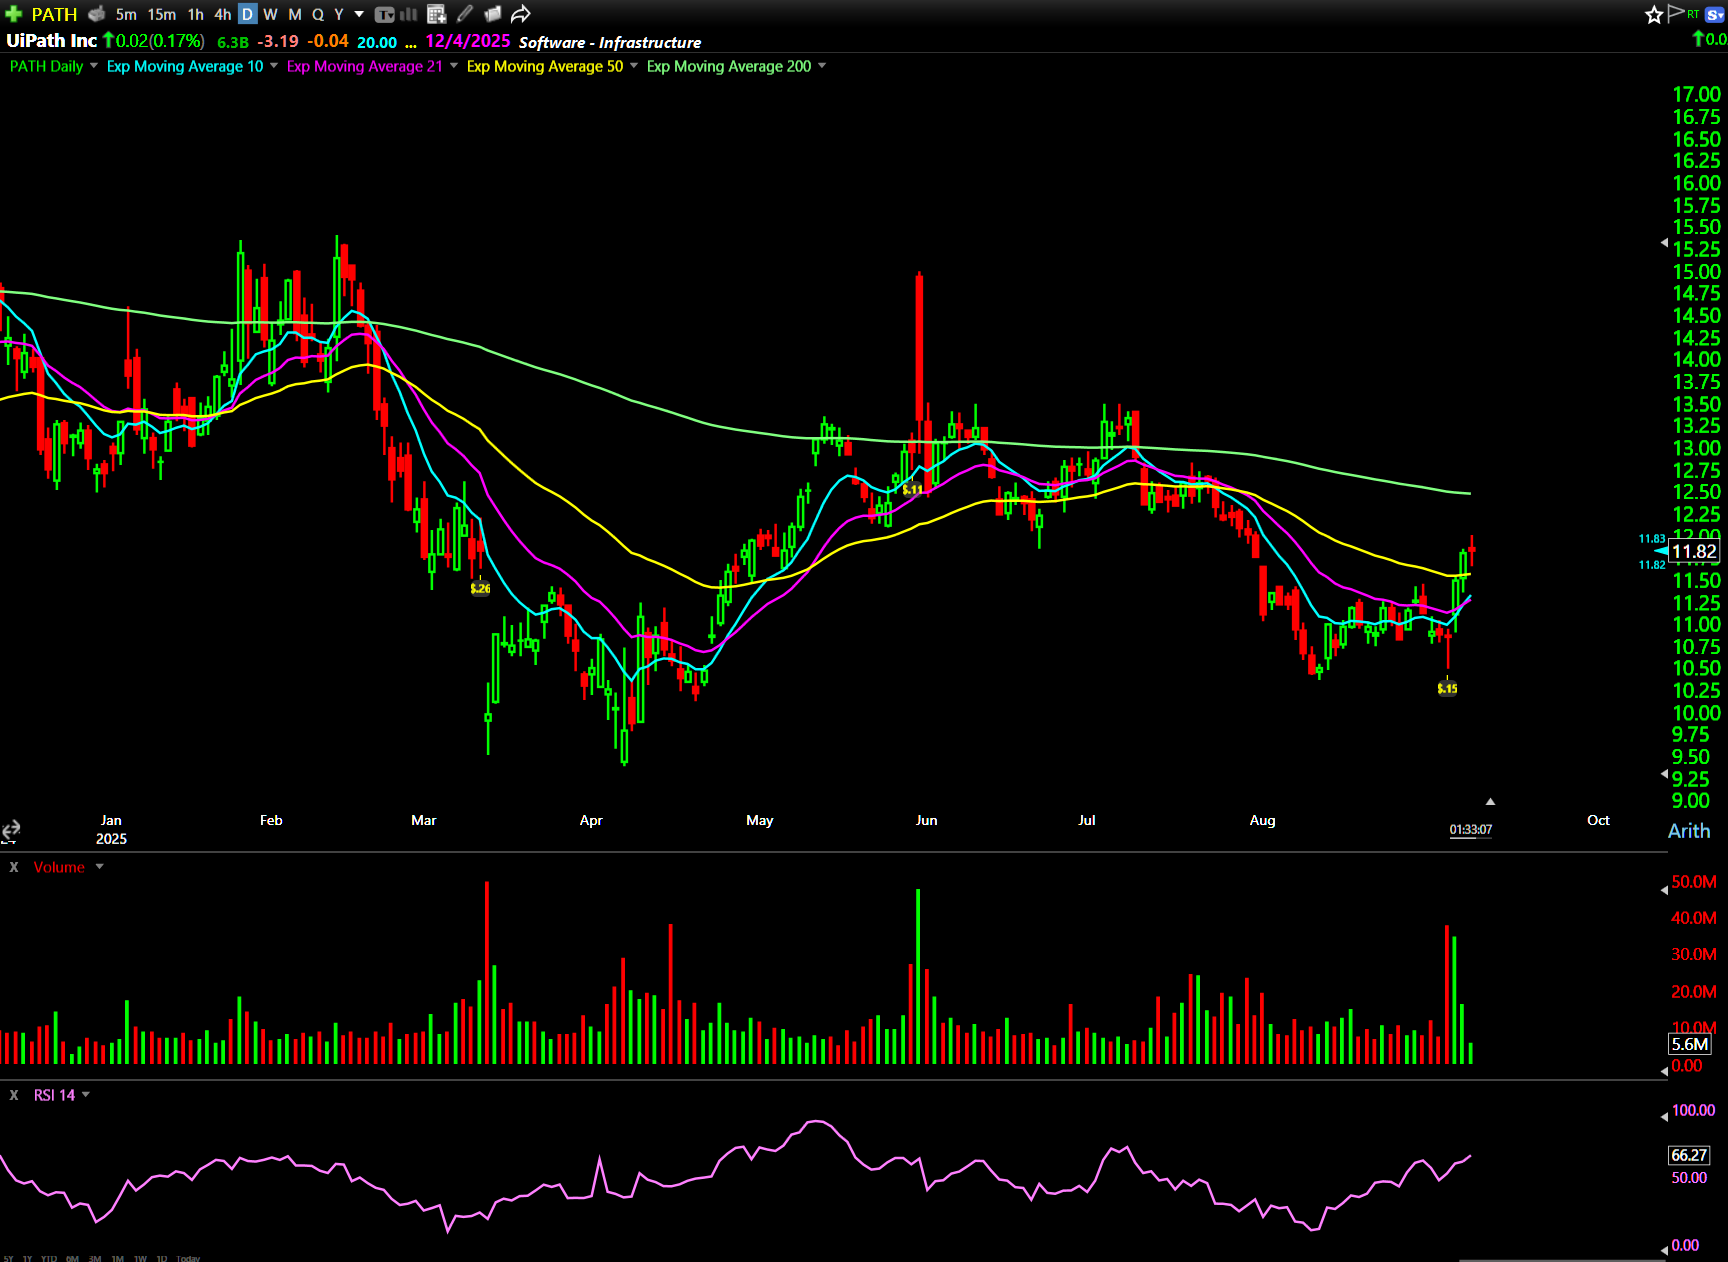
PATH delivered a classic earnings reversal. The stock dropped hard on earnings, swept prior lows, then reversed sharply on increased volume. This pattern emerges when sellers overreact and push the price too far.
The daily chart broke out of a tight range and reclaimed the 50-day moving average. That shift suggests buyers are regaining control.
If PATH holds above that moving average and pushes through $19, it could target $21 or higher. Huge potential upside on this one.
Setup #6: JD.com Inc. (NASDAQ: JD) — Clean Daily Structure
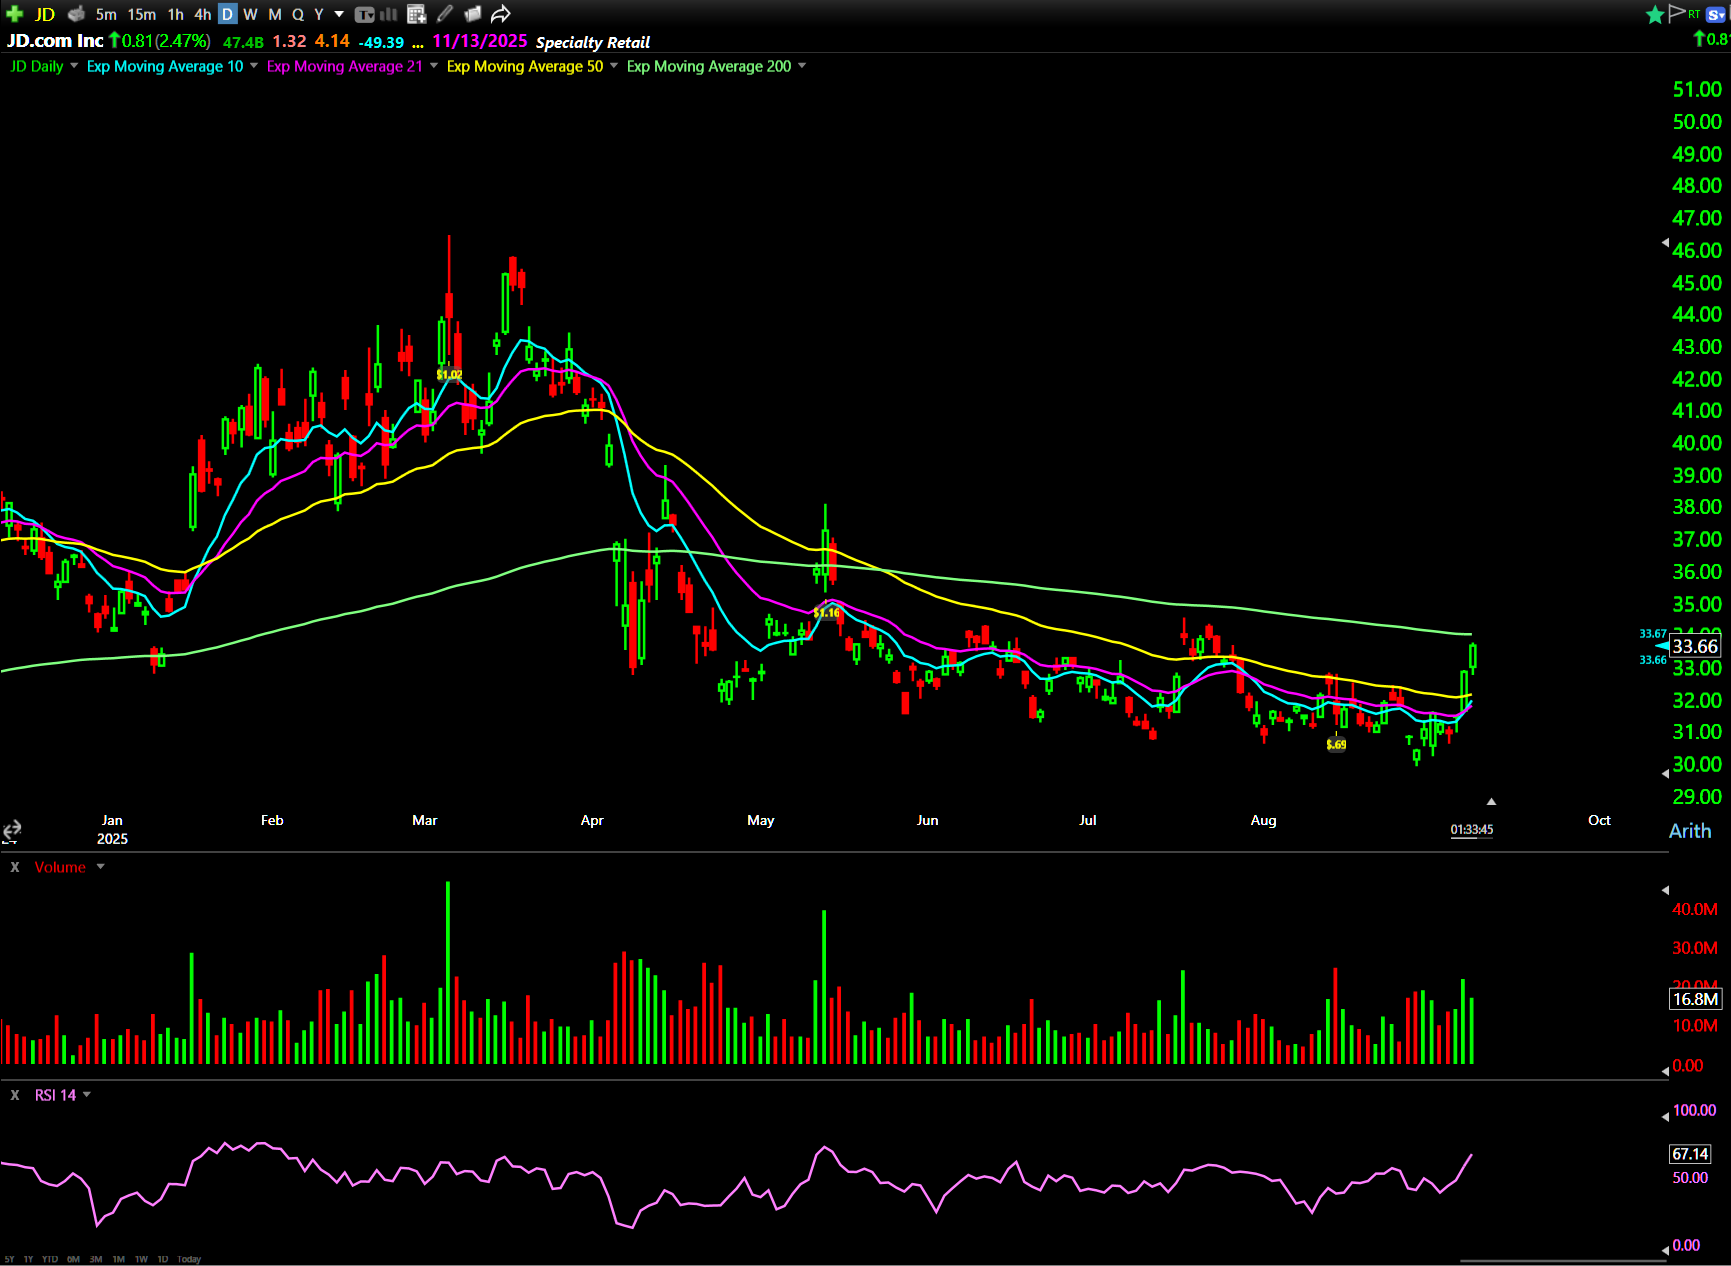
JD demonstrated clean intraday structure. The stock gapped higher, held above VWAP throughout the session, and closed near highs. That tells us buyers remained committed all day.
On the daily timeframe, JD is forming a base with rounded bottom characteristics. The push above $30.50 has opened the path for a swing move higher.
Now that it’s cleared that zone, the volume profile shows room to run.
Setup #7: Taiwan Semiconductor Manufacturing Co. Ltd. (NYSE: TSM) — High-Tight Flag
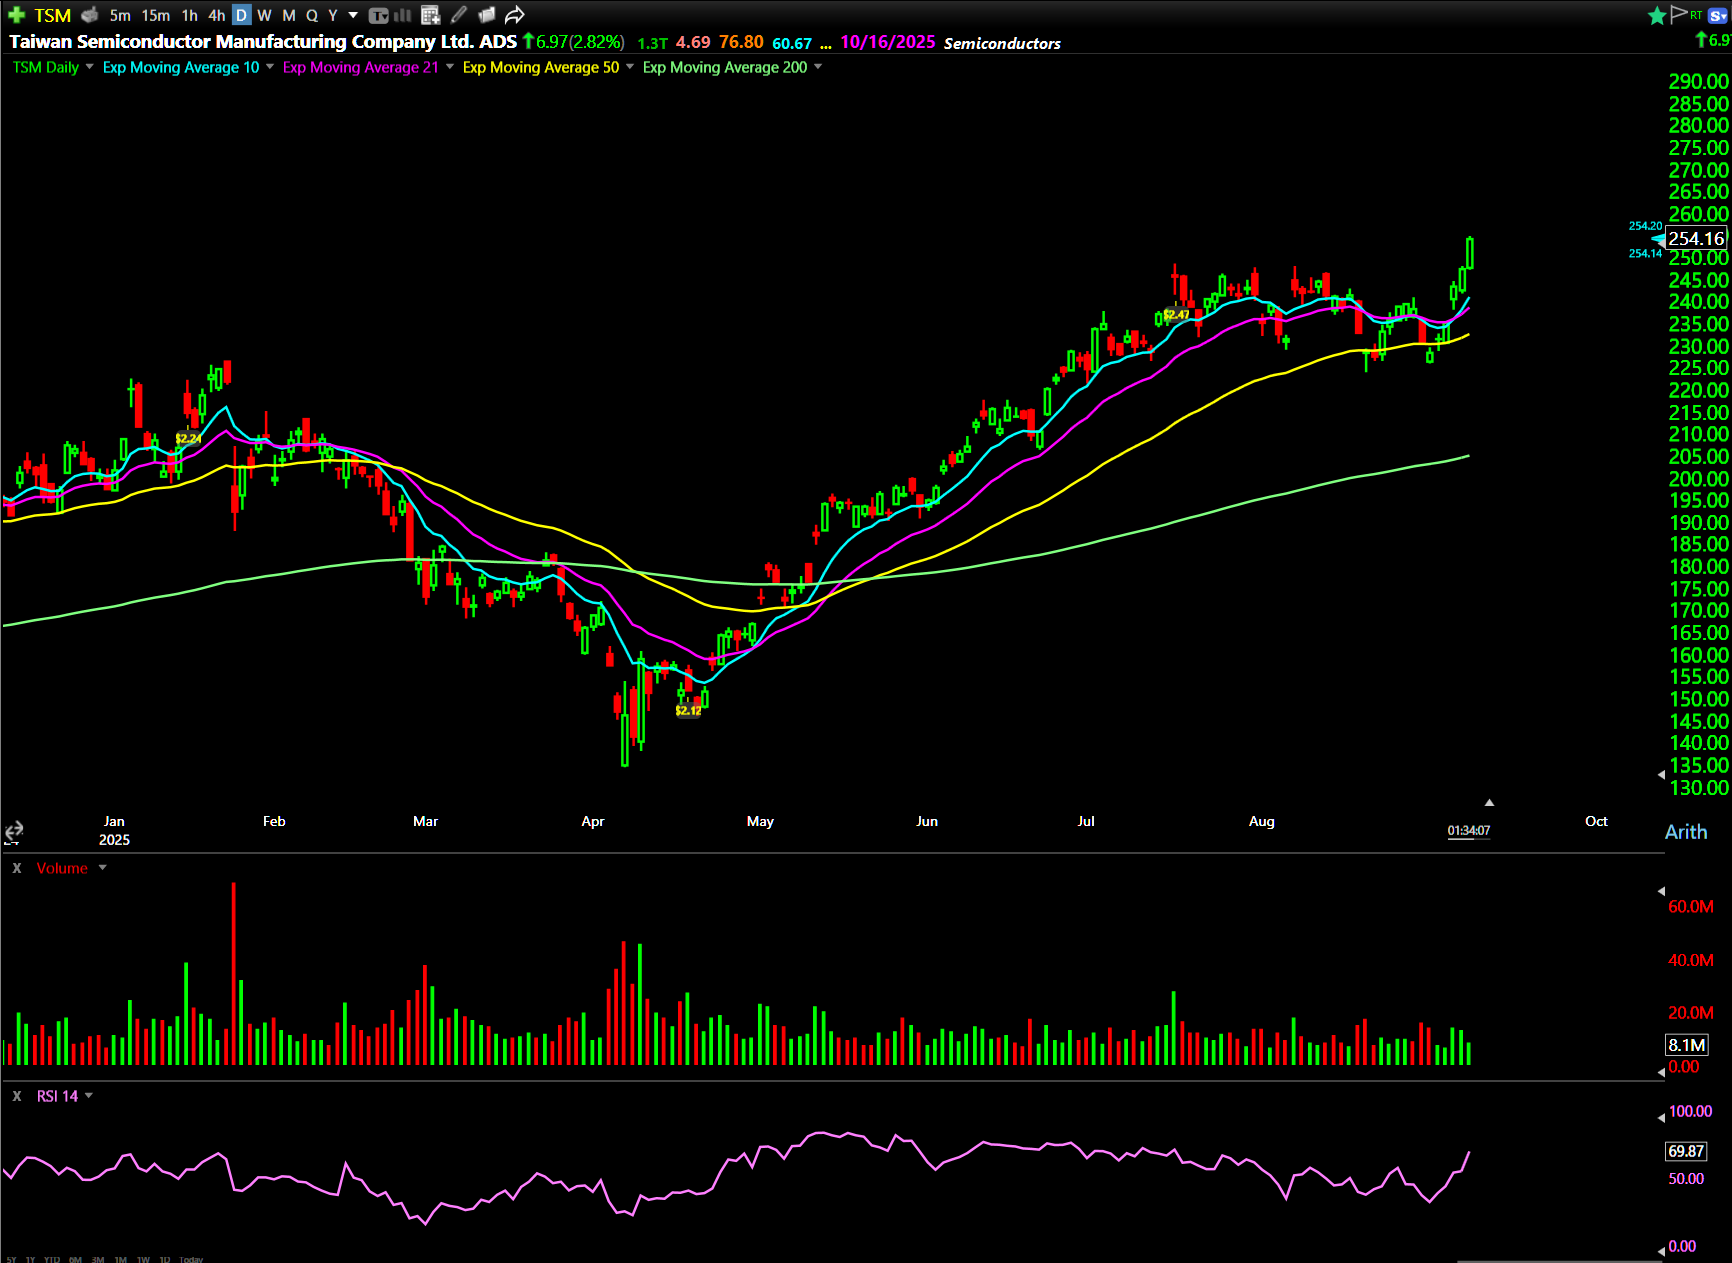
TSM is displaying one of the strongest patterns available — a high-tight flag near all-time highs.
The initial move was aggressive, and now the price is consolidating just under resistance without giving back significant gains.
Multiple large orders came through today, and there’s no sign of distribution. This remains constructive.
This current break above $248 could trigger the next leg higher. Smart Money positioning is evident here, making this a priority watch for continuation moves.
How to Approach These Setups
These seven setups demonstrate the core OIT philosophy: simple patterns, clear risk levels, and defined reward targets.
Each represents a different type of opportunity — breakouts, pullbacks, continuation patterns — but all share the same characteristics that make them perfect for busy, part-time traders.
Clean structure. Obvious entry and exit points. Risk that can be managed without constant monitoring.
The key to Options Income Trader is learning to recognize quality patterns when you see them (and having the discipline to wait for the setups to develop).
If you want to learn how to execute trades like this…
The best place to start is in our Options Income Trader Workshops.
You’re one click away from the best setups in the options market.
Join us TOMORROW at 9:00 a.m. EST.
Happy trading,
Ben Sturgill
P.S. President Trump is preparing to announce his boldest economic plan yet … a move to fast-track an unprecedented $9 trillion initiative…
But before it has a chance to become “law of the land…”
TONIGHT at 8 p.m. EST, Tim Sykes is going live with $20 million trader Jack Kellogg…
Since Trump’s return to the White House, Jack’s banked a ridiculous $5.4 million in trading profits.*
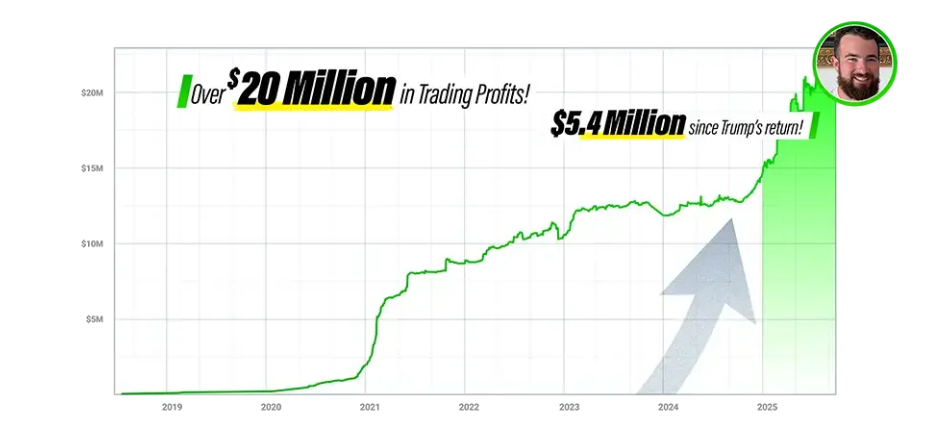
*Past performance does not indicate future results