We’ve all seen it: certain stocks move up just in time before a big announcement…
It’s almost as if a small group of “in the know” traders have information you don’t, right?
You’re not imagining things. In fact, there’s a century-old theory that explains this perfectly.
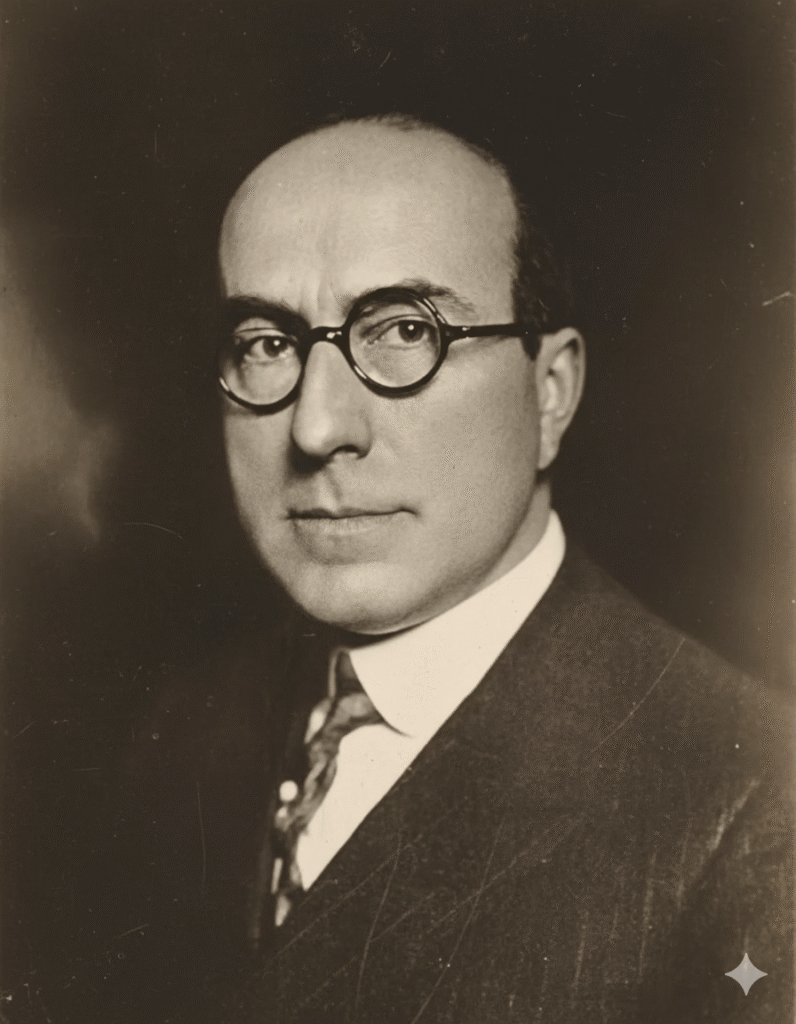
Way back in the 1920s, a guy named Richard Wyckoff realized that share price fluctuations aren’t random at all.
They follow predictable patterns based on how institutional capital flows in and out of positions.
And his methodology is more relevant today than ever.
While retail traders chase headlines and momentum, only to find themselves entering positions too late…
The Smart Money whales are quietly accumulating shares weeks (or even months) before the crowd catches on, the narrative shifts, and the bullish news is announced.
Wyckoff called it “Smart Money” behavior.
Sound familiar? It should. He paved the way for my own Smart Money trading strategy.
The key is recognizing when institutions are building positions vs. when they’re dumping shares on unsuspecting “dumb money” buyers.
Options volume is the dead giveaway.
But back then, Wyckoff had to make educated guesses about institutional activity.
You don’t. You can be certain.
My OMEN Scanner is specifically designed to track these movements with surgical precision.
The same principles apply, but the tools at your fingertips are exponentially more powerful…
We can identify exactly when (and where) the Smart Money is making their moves…
The 7 Pillars of Wyckoff Theory
Wyckoff Theory comes down to 7 foundational pillars…
The 3 Laws
Law of Supply and Demand: The most basic economic principle applied to price.
Law of Cause and Effect: The period of accumulation or distribution (the cause) will lead to a proportional trend (the effect).
Law of Effort vs. Result: Divergences between volume (effort) and price movement (result) can signal trend weakness or strength.
The 4 Phases
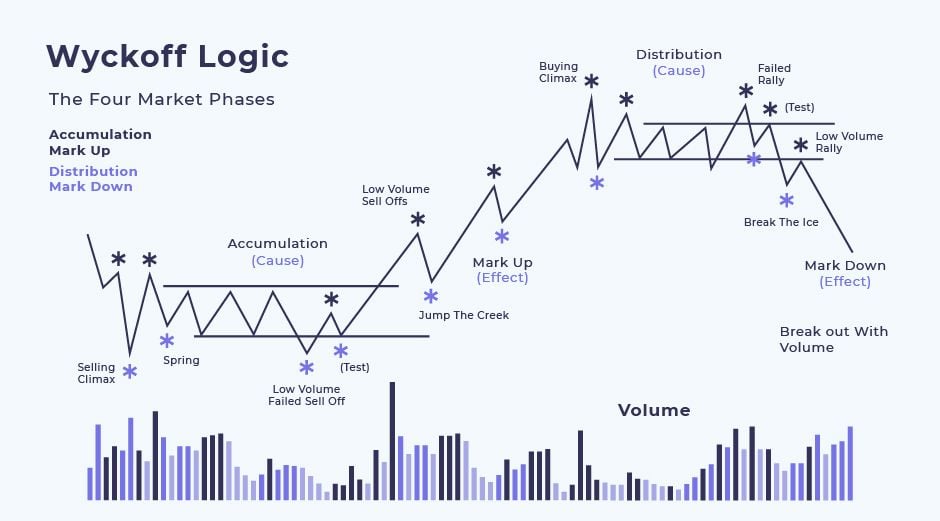
Accumulation: Smart Money buys in a range, absorbing supply.
Markup: The strong uptrend phase, where prices rise.
Distribution: The sideways range, where Smart Money offloads their holdings.
Markdown: The downtrend phase, where prices fall.
What Wyckoff Theory Shows You
Overall Market Structure
It helps you see the big picture. Is the market consolidating, trending, or reversing? This is crucial for anticipating moves.
Identifying Smart Money Positioning
Learn to spot the footprints of institutional players. Trade with them, not against them. But where Wyckoff was making informed guesses about the Smart Money’s moves, we can be certain.
Improved Entry and Exit
It shows you when each specific phase of the Wyckoff Structure starts and ends, providing high-probability entry points and excellent exit signals.
Risk Management
It gives you the market context to avoid low-probability trades in choppy conditions (and focus on Smart Money setups in bullish accumulation periods).
How I Apply This To My Trading
I start by identifying the names on my OMEN Scanner with the strongest Smart Money flow.
I then move to the charts for confirmation. I want to see the chart in a clear Accumulation phase.
I aim to enter the trade as the Accumulation phase peaks and begins transitioning into the Markup phase.
I scale out of the position throughout the Markup phase, with the goal of being 100% out by the beginning of the Distribution phase.
You can use the exact same process on…
My Top 4 Smart Money Setups
INTC May 8 $80 Calls
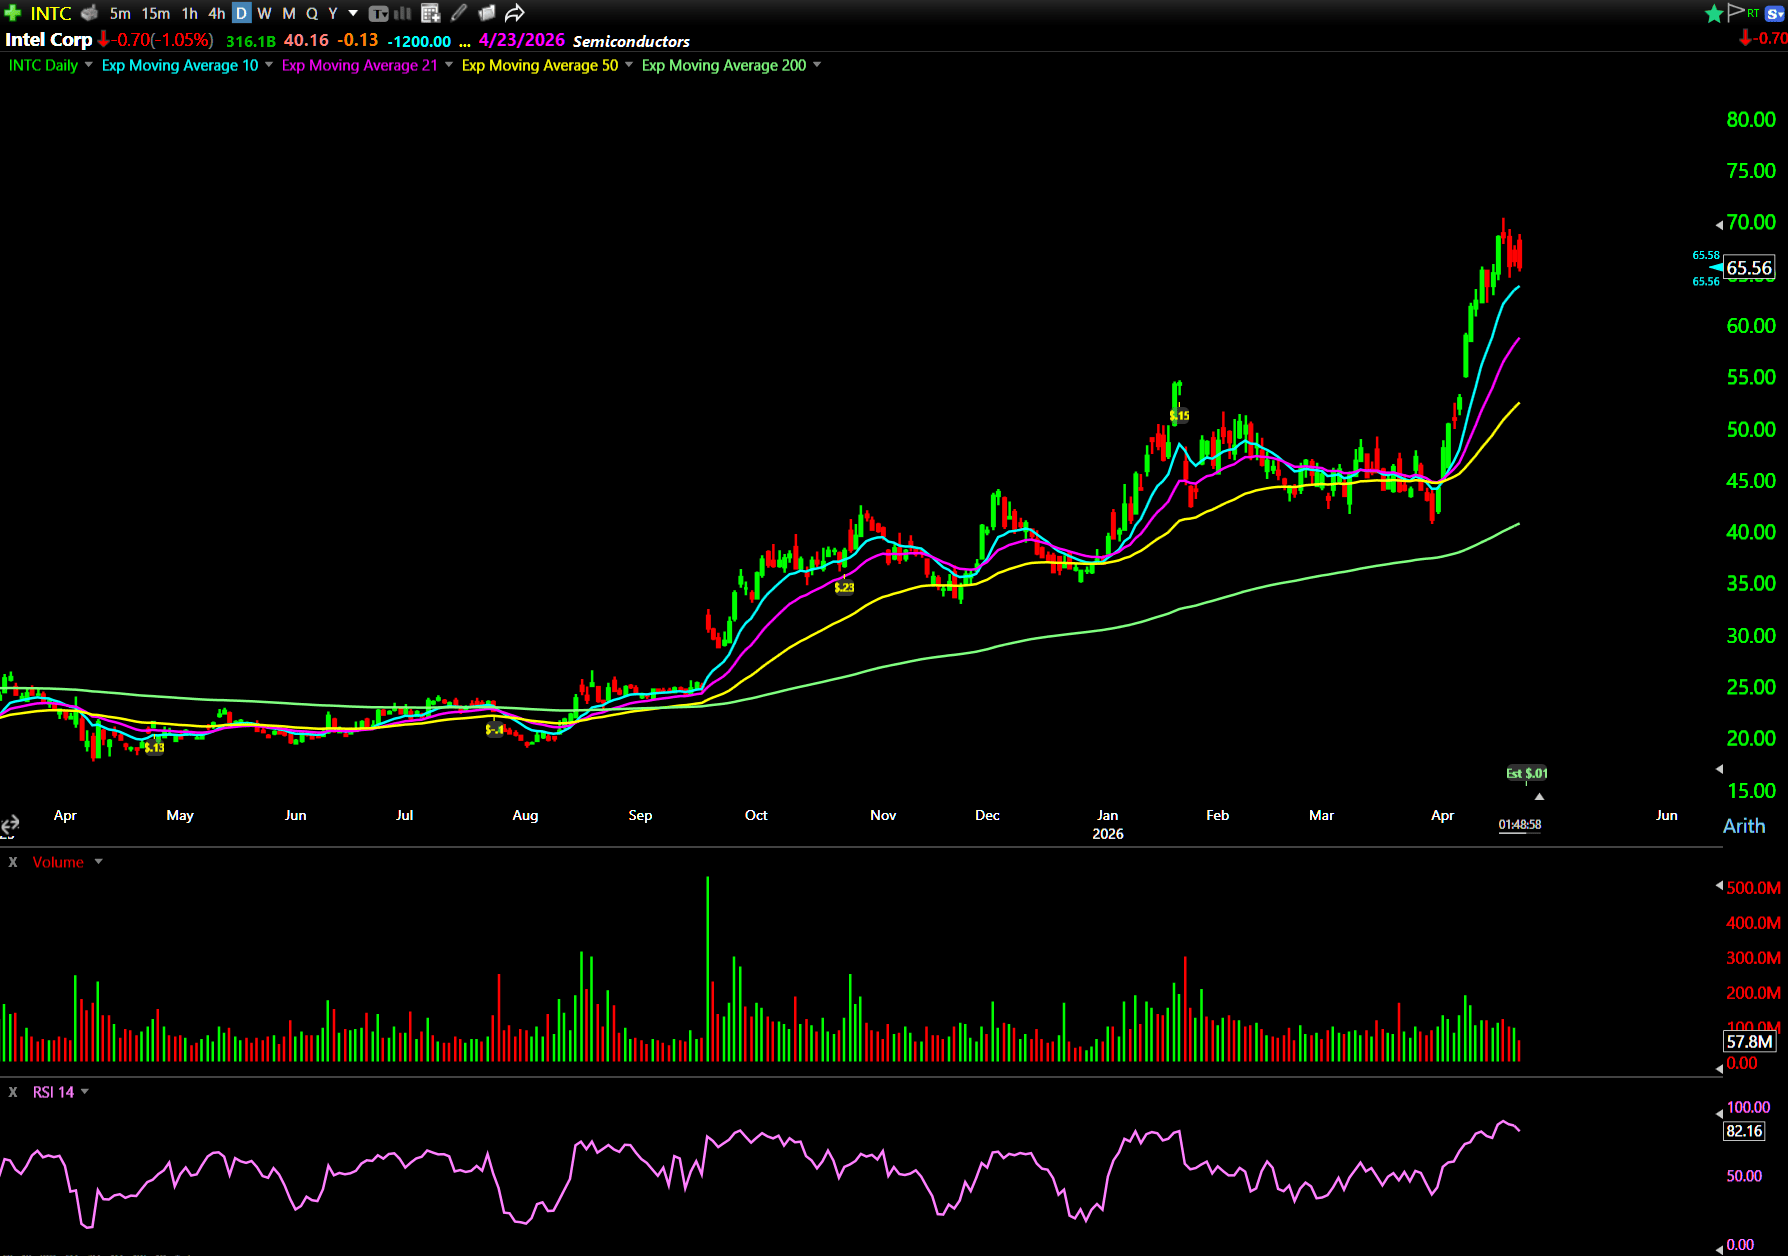
Intel Corporation (NASDAQ: INTC) went from dead money to a full re-rating. Mid-2025, it was a $20 stock with zero AI credibility.
Then the U.S. government started backing Intel’s chip manufacturing facilities. AI workloads still need CPUs alongside GPUs.
That changed the entire narrative. The stock broke out of the $20 range in mid-August 2025 and went on a 170%+ run.
Now it’s consolidating beautifully back toward the 10-day exponential moving average on the daily chart.
We’re on the fourth red day in the pullback. I’d like to see it touch the 10-day EMA around $63.80. That could be a good entry point for these May 8 $80 calls.
These calls are ambitious, but they have massive volume.
HIMS May 22 $35 Calls
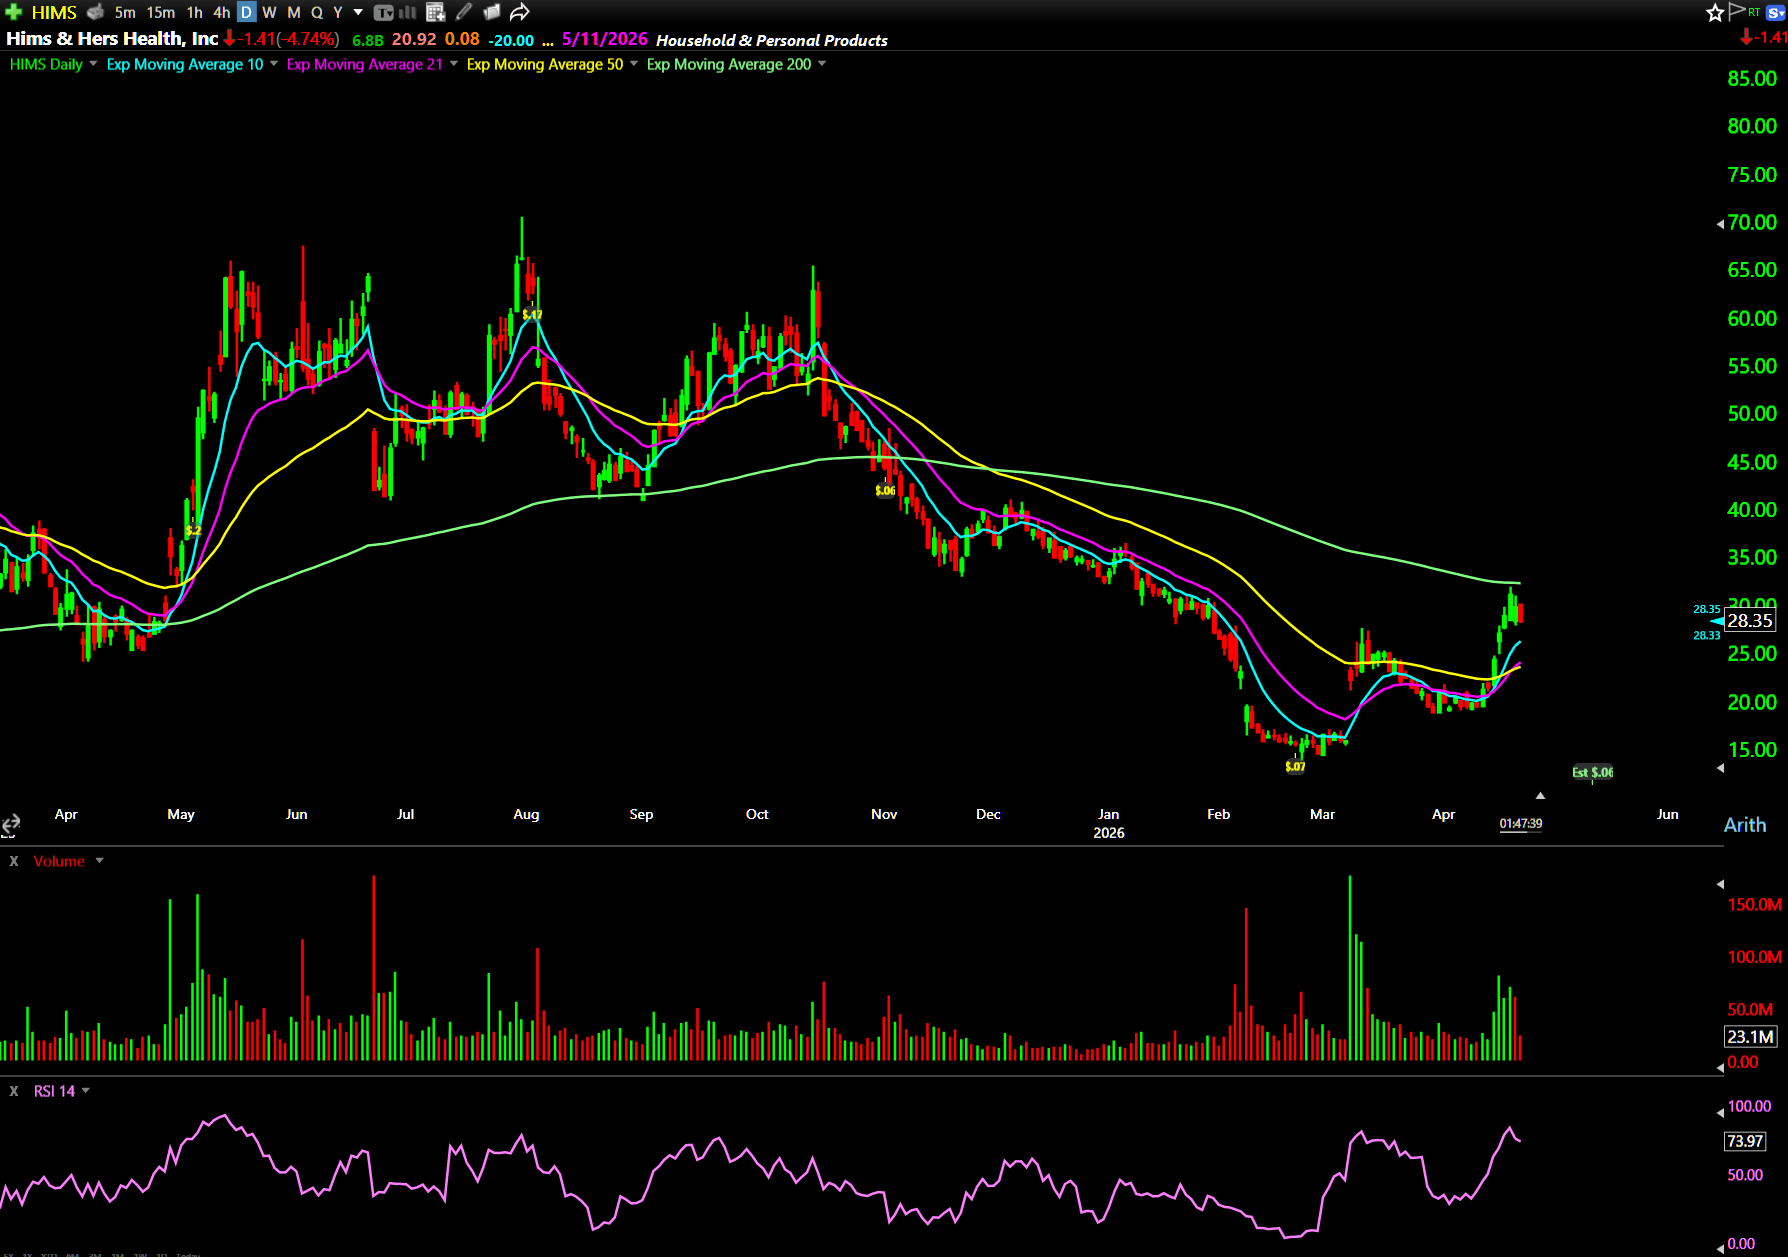
Hims & Hers Health Inc. (NYSE: HIMS) ripped in 2025 when it started carrying Ozempic.
Then the company had a big dispute with Ozempic’s manufacturer, Novo Nordisk A/S (NYSE: NVO). The stock went down 75% in five months from October 2025 to March 2026.
On March 7, HIMS resolved the dispute with NVO and announced they’d carry Ozempic again. The stock gained over 50% in one day.
Then it pulled back 30%. It found support at $19 and consolidated there for two weeks.
Now, we’re seeing another big breakout. It’s moved 65% in eight days.
Just like INTC, I’d like to see a pullback to the 10-day EMA (currently around $26.30). And there’s resistance at the 200-day exponential moving average (around $32).
If it can break that, a move to $35 is definitely in play. These calls give you about a month to realize this on a swing trade.
TSLA May 29 $450 Calls
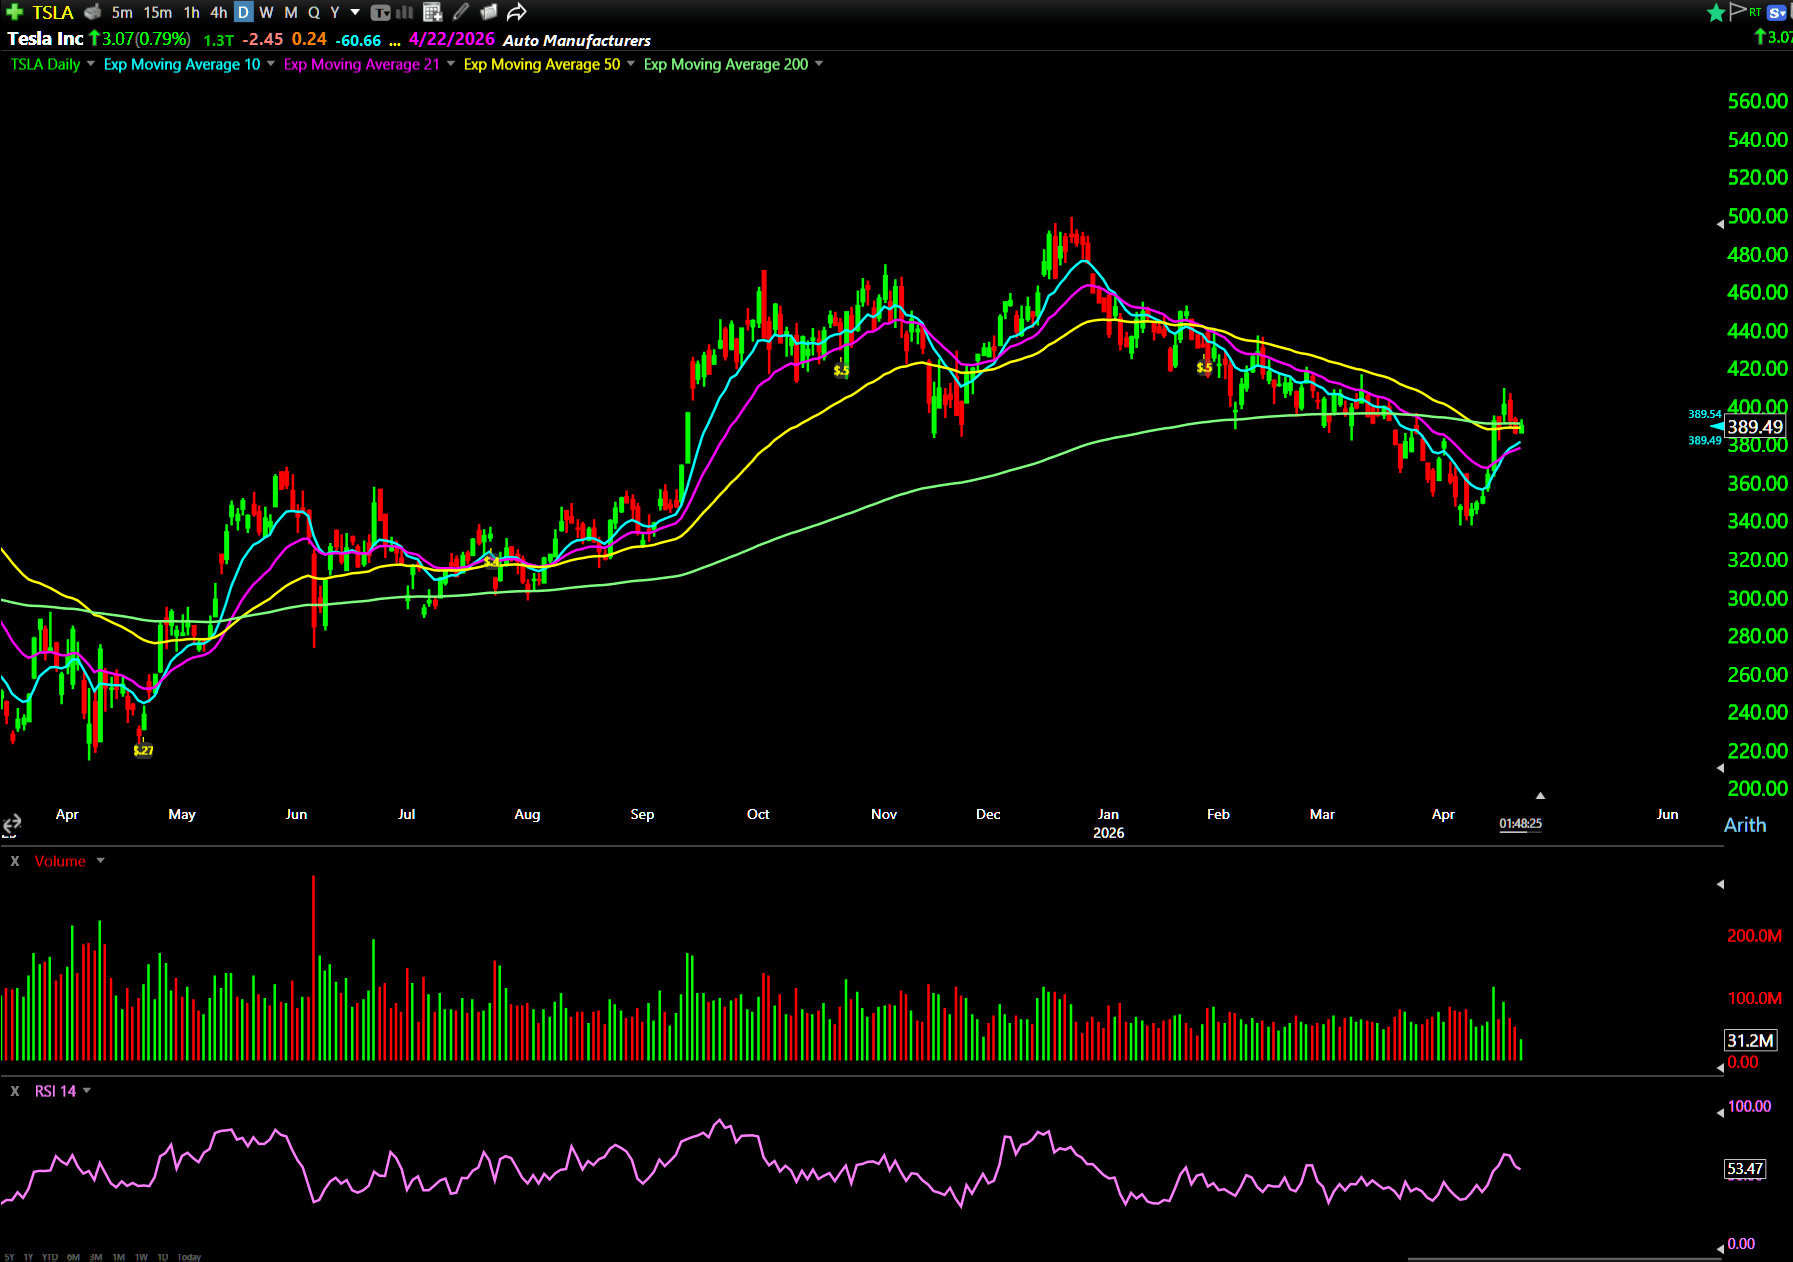
Tesla Inc. (NASDAQ: TSLA) has two major catalysts that aren’t fully priced in yet…
- The Optimus humanoid robot. If viable (which I think it will be), it reframes TSLA as a robotics company at the forefront of an exciting new industry.
- Second: The upcoming SpaceX IPO could trigger sympathy-driven capital flows and FOMO buying into TSLA shares.
The stock has had a rough 2026 after double-topping in the high $490s, But over the past nine trading sessions, we’ve seen a 20% breakout.
It had this big run, and now it’s bull-flagging into a small, controlled pullback (getting really close to the 10-day exponential moving average around $380).
These May 29 $450 calls are about 17% out of the money right now.
Ambitious, but nothing TSLA can’t do.
Especially if the SpaceX hype gets real.
RKT June 18 $25 Calls
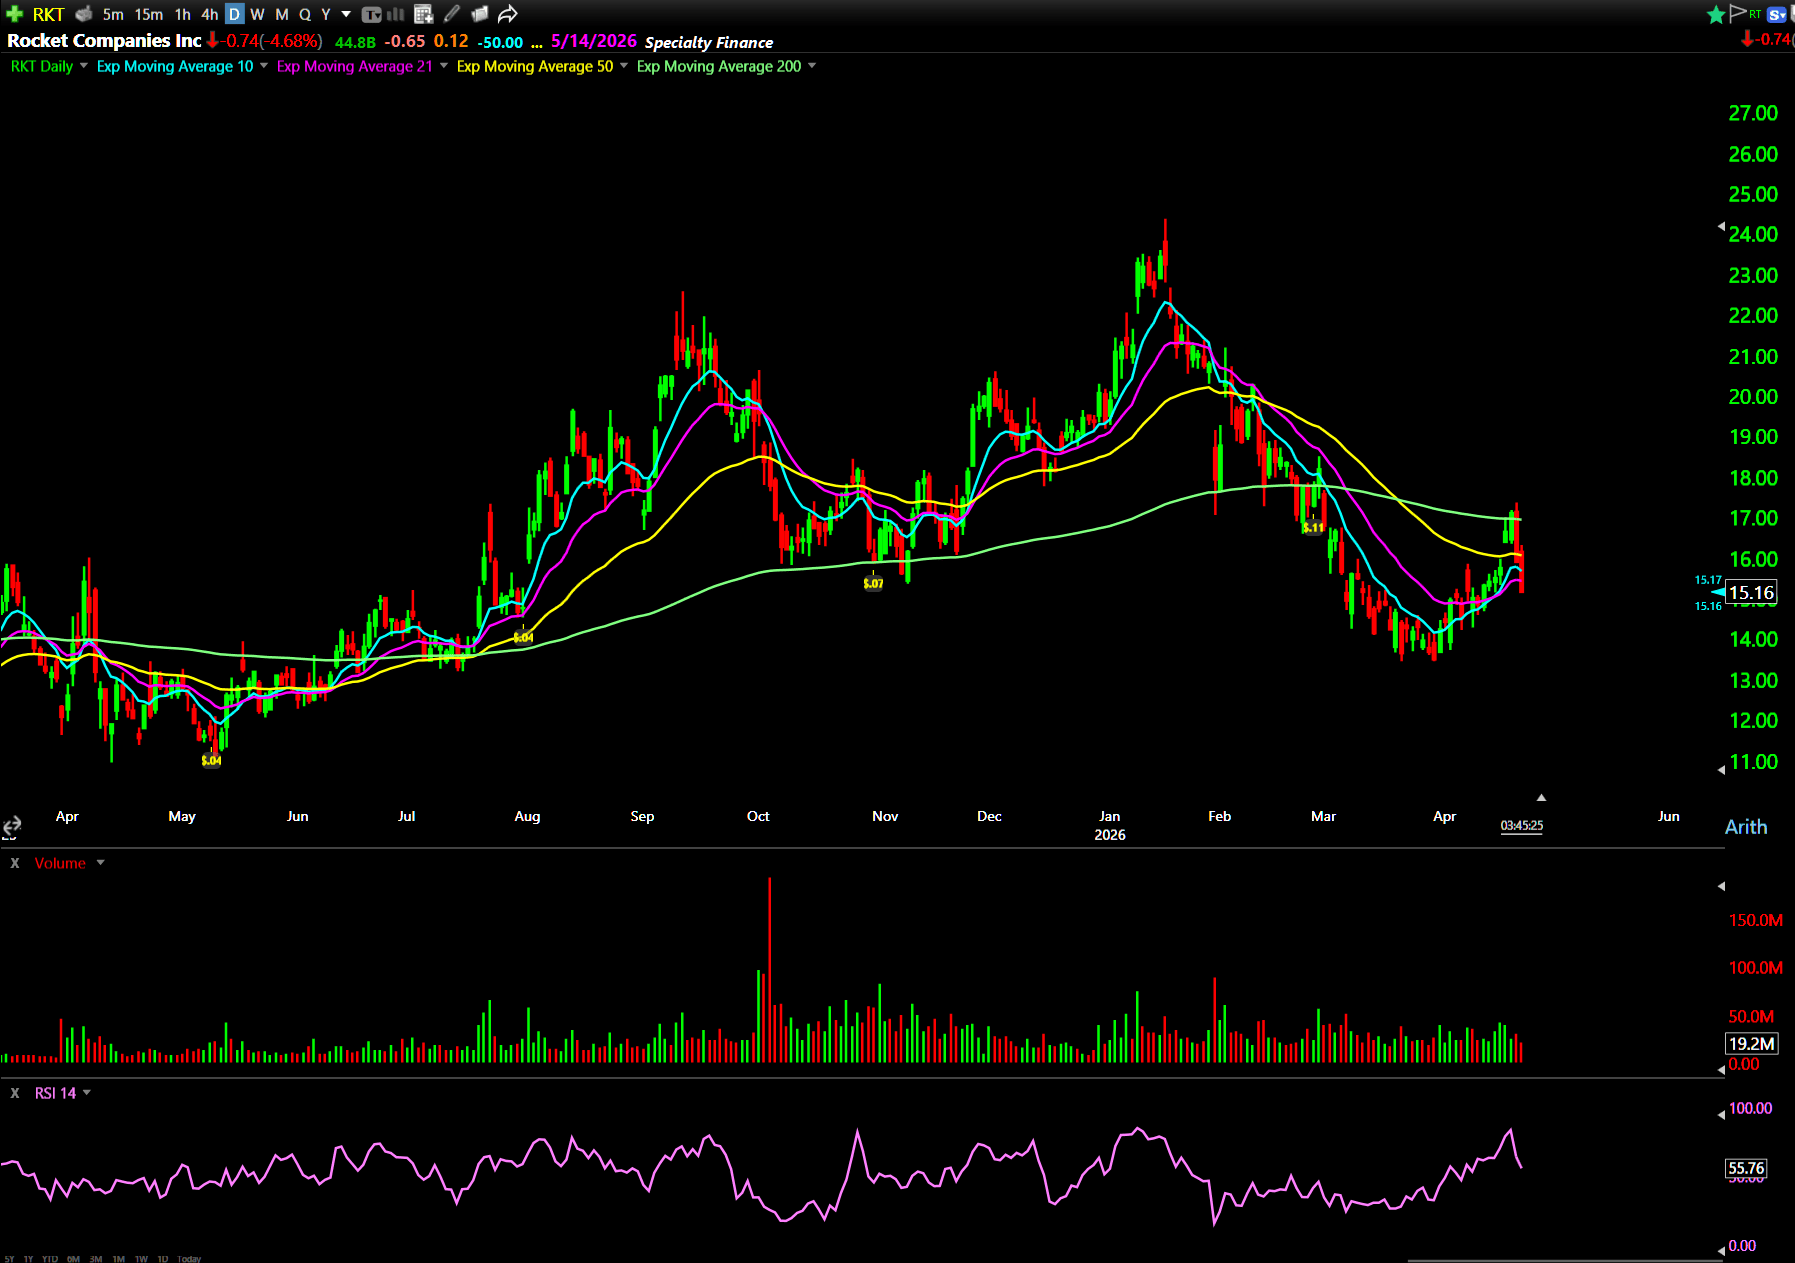
Rocket Companies Inc. (NYSE: RKT) is a pure macro play in disguise. This stock is incredibly rate-sensitive. Speculation of future rate cuts can cause the stock to move.
There was speculation about further rate cuts toward the end of last year and the beginning of 2026. The stock went to around $25. Big psychological resistance. Got rejected. Pulled back 45% in two months.
Now we’re seeing a reversal off that pullback. RKT went up about 30% in three weeks. It’s had two pretty sizable red days this week. Down 10% off the highs. Trying to hold the 21-day exponential moving average, even trading slightly below it.
This is a good risk-reward entry for June 18 $25 calls. You’re making a bet that Jerome Powell’s out. Kevin Warsh is in. Interest rates get cut.
Can this stock make a 60% move in two months? You don’t have to take these all the way to the strike.
Even if the stock moves 10% to 15%, these calls probably double or triple.
You can scale out, lock up your initial investment, and let house money ride.
What These 4 Setups Have in Common
All four of these stocks are following similar patterns on their daily charts:
- They’ve shown recent historical strength.
- They had big pullbacks over the last few months (due to the war in Iran).
- They’ve broken into new uptrends.
- And now, they’re starting to pull back to great risk/reward levels (after a parabolic run in the major indexes).
The VIX is breaking down, the indexes are breaking out…
Prime time for some swing trades.
And when it comes to picking the right stocks…
Wyckoff gave you the framework over a century ago.
My OMEN Scanner gives you a level of detail and flexibility he could’ve only dreamed of.
Combine these forces, and you’ll be practically unstoppable.
Be good (and be good to others),
Ben Sturgill
*Past performance does not indicate future results