Good morning, traders…
Imagine you’re holding calls on a stock that’s been bouncing between the same levels for three weeks straight.
Up to $135, back down to $125. Up to $135, back down to $125. The pattern repeats like a broken record … and you’re starting to question whether this position is worth holding.
This frustration is exactly what the market wants you to feel. While you’re getting antsy about the sideways action, institutional traders are quietly positioning for the eventual resolution.
They understand something that escapes many individual investors: consolidation often creates the foundation for the next significant move.
The difference between profitable and unprofitable approaches to these situations comes down to three things: pattern recognition, emotional control, and systematic execution.
What looks like frustrating sideways action to most people is actually a clear pattern with predictable behaviors.
Once you know what to look for, these ranges become some of the most reliable setups in the market.
Let Me Show You How To Turn Trading Ranges Into Your New Advantage…
What Are Trading Ranges?
A trading range represents the zone between clear support and resistance where a stock consolidates without trending. Instead of making consistently higher highs or lower lows, the stock “chops” back and forth within defined boundaries.
You’ll see these ranges on any timeframe — from 5-minute intraday charts to daily and weekly patterns.
The key characteristics never change: repeated bounces off a low zone (support) and repeated rejections at a high zone (resistance).
Many traders get spooked when stocks pull back within these ranges, but this behavior is completely normal. As long as the price stays within the established boundaries, the pattern is working as expected.
Not All Ranges Are Created Equal
You need medium-to-large size ranges that provide enough room to justify intra-range trading.
A $3 range — say from $42 to $45 — doesn’t offer enough “meat on the bone” to generate meaningful returns, especially with options.
Avoid narrow ranges at all costs.
Transaction fees, bid-ask spreads, and time decay will eat up most of your potential gains.
Look for ranges with at least $8 to $10 of movement, preferably more. A stock bouncing between $125 and $135 gives you room to work.
3 Ways to Trade Ranges
Buying the Bottom of the Range
This approach offers the best risk-reward ratio but requires patience. Wait for the share price to approach support, then enter with stops placed just below the range bottom. This gives you the entire range height as potential upside while risking only the distance to your stop-loss.
Taking Profits at the Top
For shorter-term traders, booking gains as the share price approaches resistance can capture quick wins. When price stalls near the top of the range, consider exiting long positions rather than hoping for an immediate breakout.
Buying the Breakout
Wait for the share price to break above resistance, ideally with increased volume, then enter.
Use the former resistance level as your stop-loss zone in case of a false breakout. I like to confirm breakouts with Smart Money flow to increase the odds of success.
(More on this in a moment…)
The Darvas Box Method
Nicolas Darvas developed one of the most famous range trading systems while traveling as a professional dancer.
Using only telegrams to place orders, his approach was elegantly simple:
- Identify a trading box (range).
- Buy the breakout above resistance.
- Stay in the trade as long as the price holds above the new support level.
- Exit if the price breaks below.
Real-World Example
From May through August, Apple Inc. (NASDAQ: AAPL) was rangebound between $193 and $215…
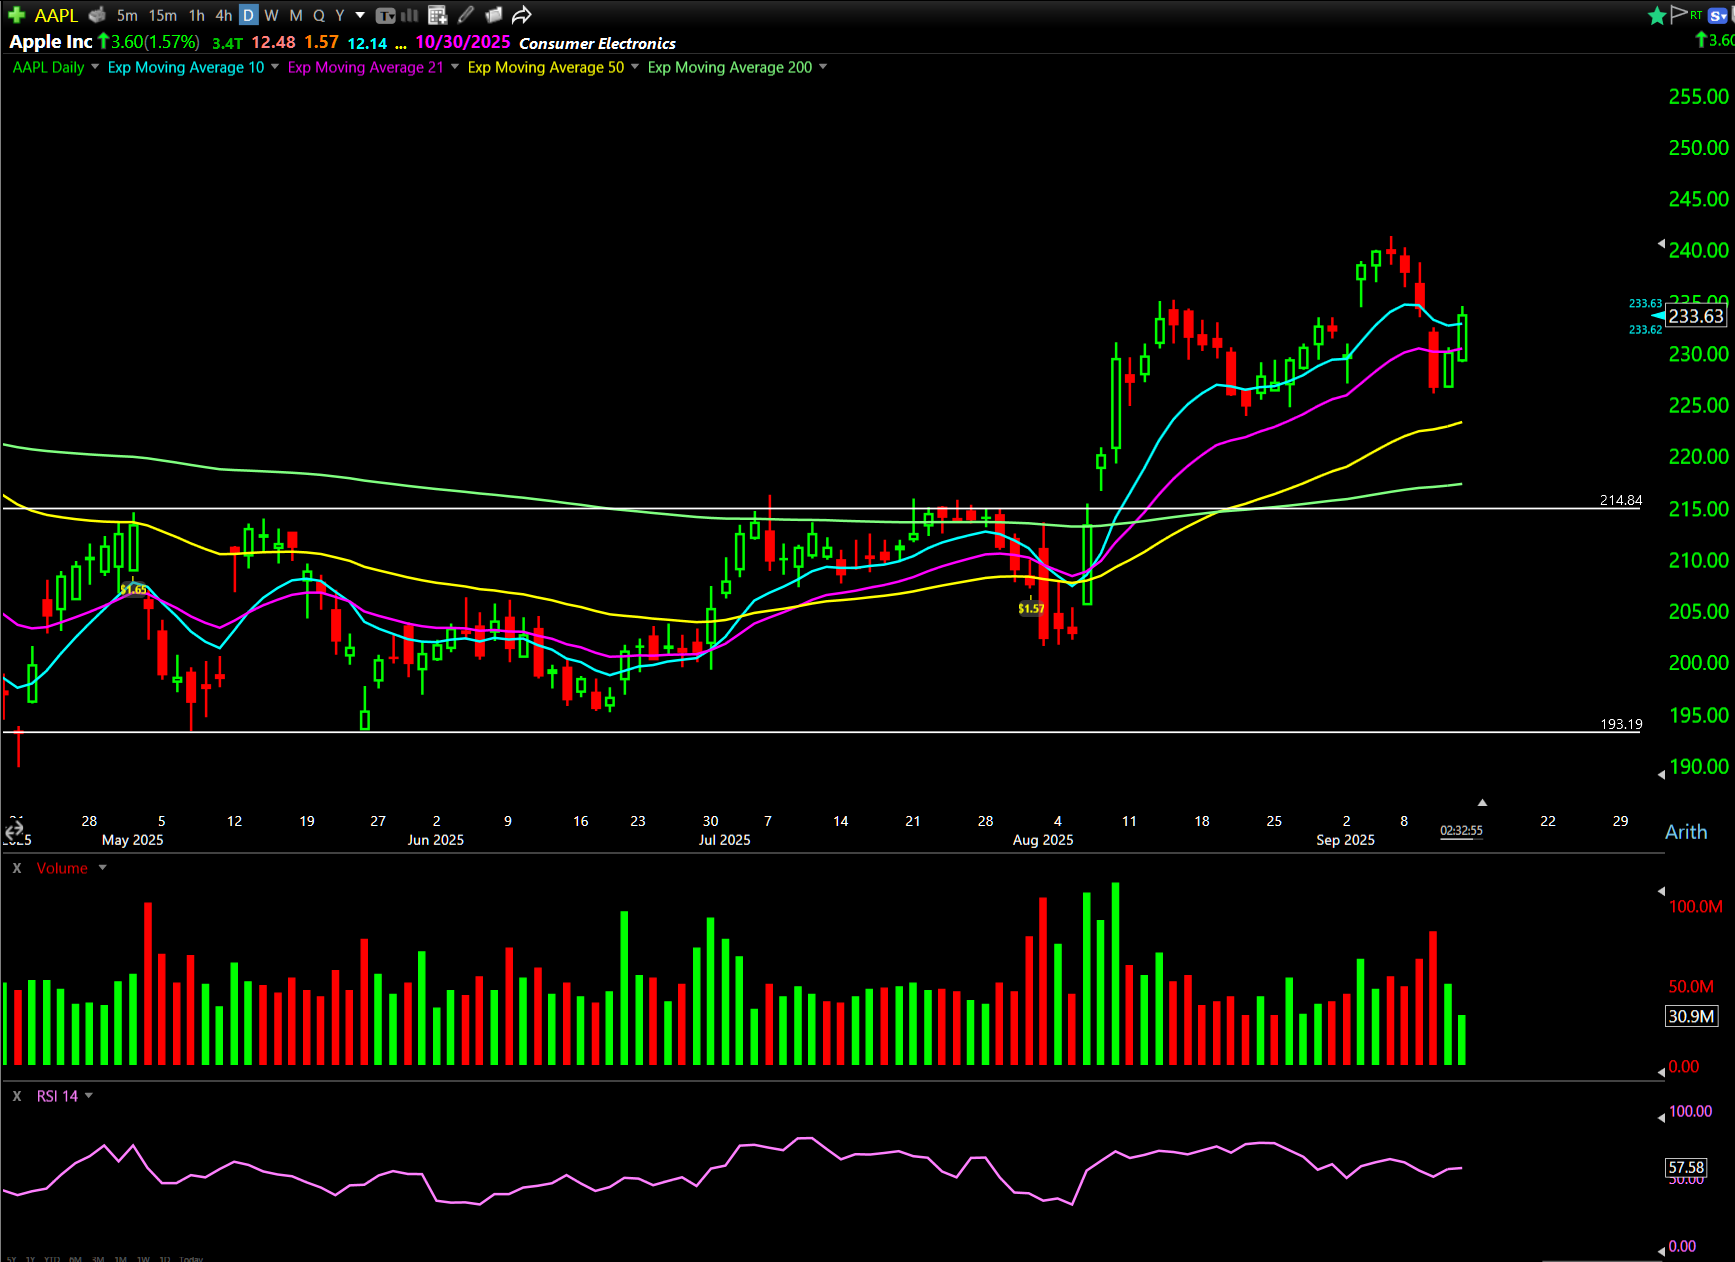
That’s a big enough range to trade.
You could’ve reliably bought calls whenever the stock drifted back towards $193.
And sold those calls near $215.
But the best trade came on the breakout.
Once the chart finally closed above $215 after four long months of waiting, the move was explosive.
That was the exact moment I entered one of my biggest trades of the year:

- First scale at $3.40 on 8/5 → +21.43%
- Second scale at $4.25 on 8/5 → +51.79%
- Third scale at $5.00 on 8/5 → +78.57%
- Fourth scale at $5.60 on 8/6 → +100.00%
- Fifth scale at $7.00 on 8/6 → +150.00%
- Sixth scale at $10.00 on 8/7 → +257.14%
- Seventh scale at $12.00 on 8/8 → +328.57%
- Final scale at $17.25 on 8/8 → +516.07%
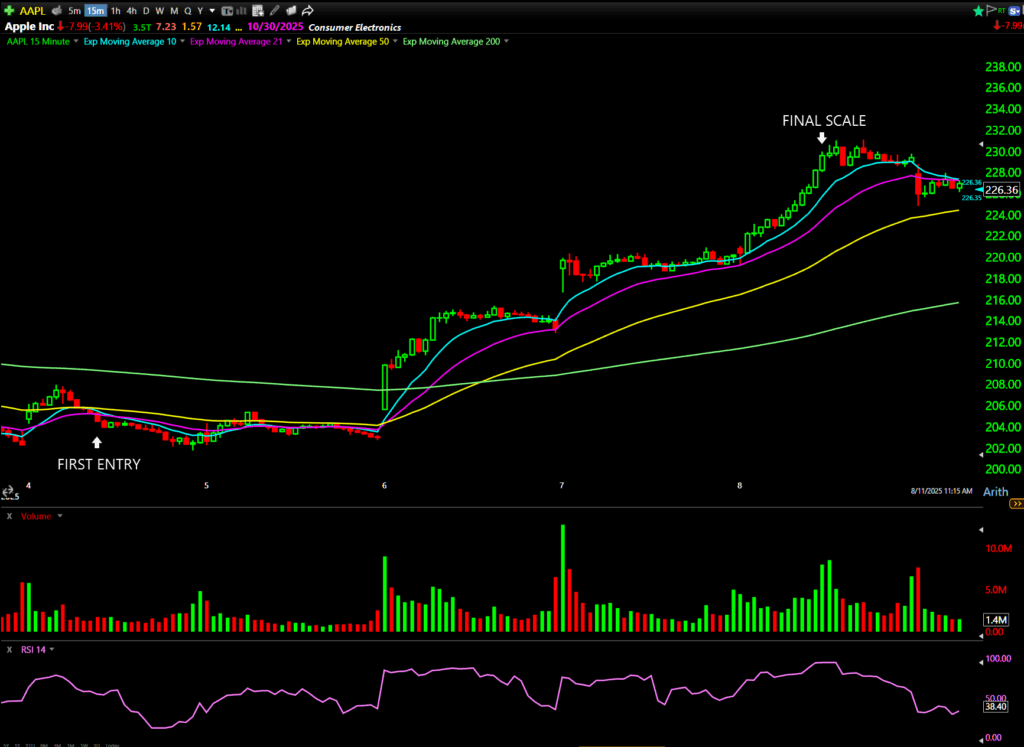
From $2.80 to $17.25 — a 516% gain in five trading days.*
This is the setup I’ve been using to OUTSMART Wall Street with what I call The “Dumb Money” Double…
A controversial (yet 100% legal) way to turn what they call “dumb” into double and triple-digit gains, 9 out of 10 times.
That’s generated +57% AVERAGE GAINS and a 93% WIN-RATE this year.
And this week, for the first time ever, you have the chance to see how I do it…
Join me for the “Dumb Money” Summit on Wednesday, September 17th — 8pm ET/5pm PT
Click Here To Save Your Free Seat Now.
See you there,
Ben Sturgill
*Past performance does not indicate future results