Good morning, traders…
I have a simple question for you:
What exactly causes the most dramatic moves in stock prices?
You’re probably thinking about the Fed, corporate earnings, and news, but that’s wrong…
More than anything else, stock prices are driven by emotions.
Buying and selling happen because of how traders feel about a particular company, sector, or fund.
Your response to anything in life has a lot to do with your emotional state at the time. The stock market is no different.
Understanding how the collective psychology of market participants affects prices can give you a priceless edge as a trader.
After teaching thousands of students, I’m convinced that most traders’ Achilles heels come down to mindset — not fundamental or technical analysis.
Let Me Show You How To Use The Collective Emotions Of Market Participants To Figure Out Where Stocks Might Be Heading Next…
The Single Biggest Influence on Share Price
First, you need to understand what a “share price” really is (and how emotions can influence it).
Share prices are the current market prices of a single unit (or “share”) of a company’s stock.
More buyers than sellers? The price goes up. More sellers than buyers? The price drops.
Economics 101. Supply and demand.
What the public thinks and feels about that company is demonstrated in the price it’s trading for.
Think about after-market concert tickets. If the band just released a bad album, their tickets probably aren’t gonna fly off the shelves.
But if Taylor Swift announces a surprise show tonight, the emotions of her fans will drive them to pay just about anything to go to that show.
Compare this to earnings season. If a company reports bad earnings, the share price usually goes down.
This is just like the band with the bad album trying to sell tickets — demand is low because no one is emotionally driven to buy the stock.
Meanwhile, everyone wants to own shares of Nvidia Corporation (NASDAQ: NVDA) because it made $45 billion in revenue last quarter.
Keyword: want.
At a core psychological level, everything you do in life is driven by wants and desires, feelings and emotions…
Recognize that truth in the stock market, and you can weaponize it to your advantage.
And speaking of earnings season…
Are you ready for the $5k Summer Blitz?
Our goal? To make a 400% return on a small account.
$1000 → $5,000 by October 14.
We already 3x’d a small account TWICE using my Earnings Edge system…*
And if we DON’T turn $1,000 into $5,000 by October 14th…
We’re giving everyone who joins our “$5K Blitz Challenge” an exclusive $5,000 value gift…
Completely FREE of charge.
5x or bust.
That’s how confident we are.
Join Danny Phee TONIGHT at 8:00 p.m EST to see exactly how we’ll conquer the challenge.
The Cycle of Fear and Greed
Knowing that share prices come from emotion will do you no good if you can’t put that knowledge into action (and turn that action into profits).
How do you do that? By understanding the cycle of fear and greed in the market.
Our emotions try to play tricks on us when we’re trading…
To most people, it feels better to buy stocks when they’re going up than it does to buy them when they’re getting destroyed.
But if you want to beat the market and create an edge, you need to re-program your brain to do the opposite…
Take a look at the S&P 500 chart going all the way back to 1900:
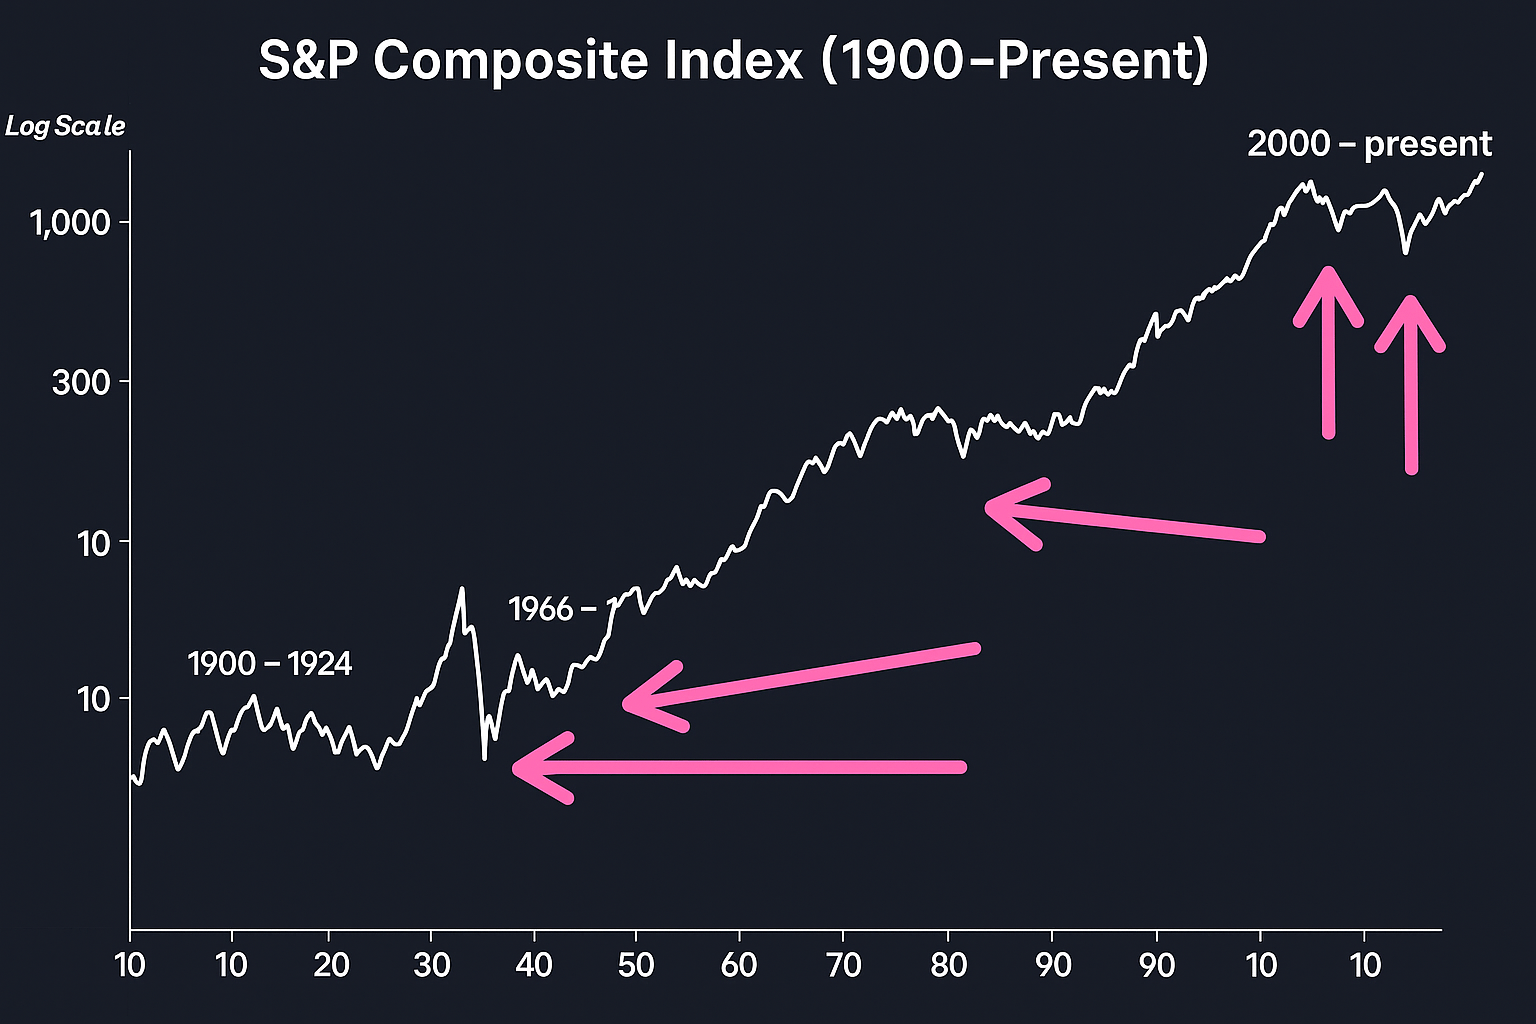
Notice that the best times to buy stocks were the periods of the most palpable fear…
The Great Depression, the Vietnam War, the 2008 financial crisis, the COVID-19 pandemic — if you had gone long at any of these points on the chart, you would’ve made a fortune.
You can also apply the same kind of emotional analysis to short-term options trading.
If you see a former runner pulling back to an important level and holding it, consider buying some calls.
Violent snapbacks off of the lows are the best call-buying opportunities … period.
The contract prices get extremely beaten down during the sell-off, creating enormous potential upside during the snapback.
We’ve all heard “buy low, sell high,” but many traders forget about this crucial rule in the moment.
Don’t you wish you could take a time machine back to April and buy September calls on Robinhood Markets Inc. (NASDAQ: HOOD)?
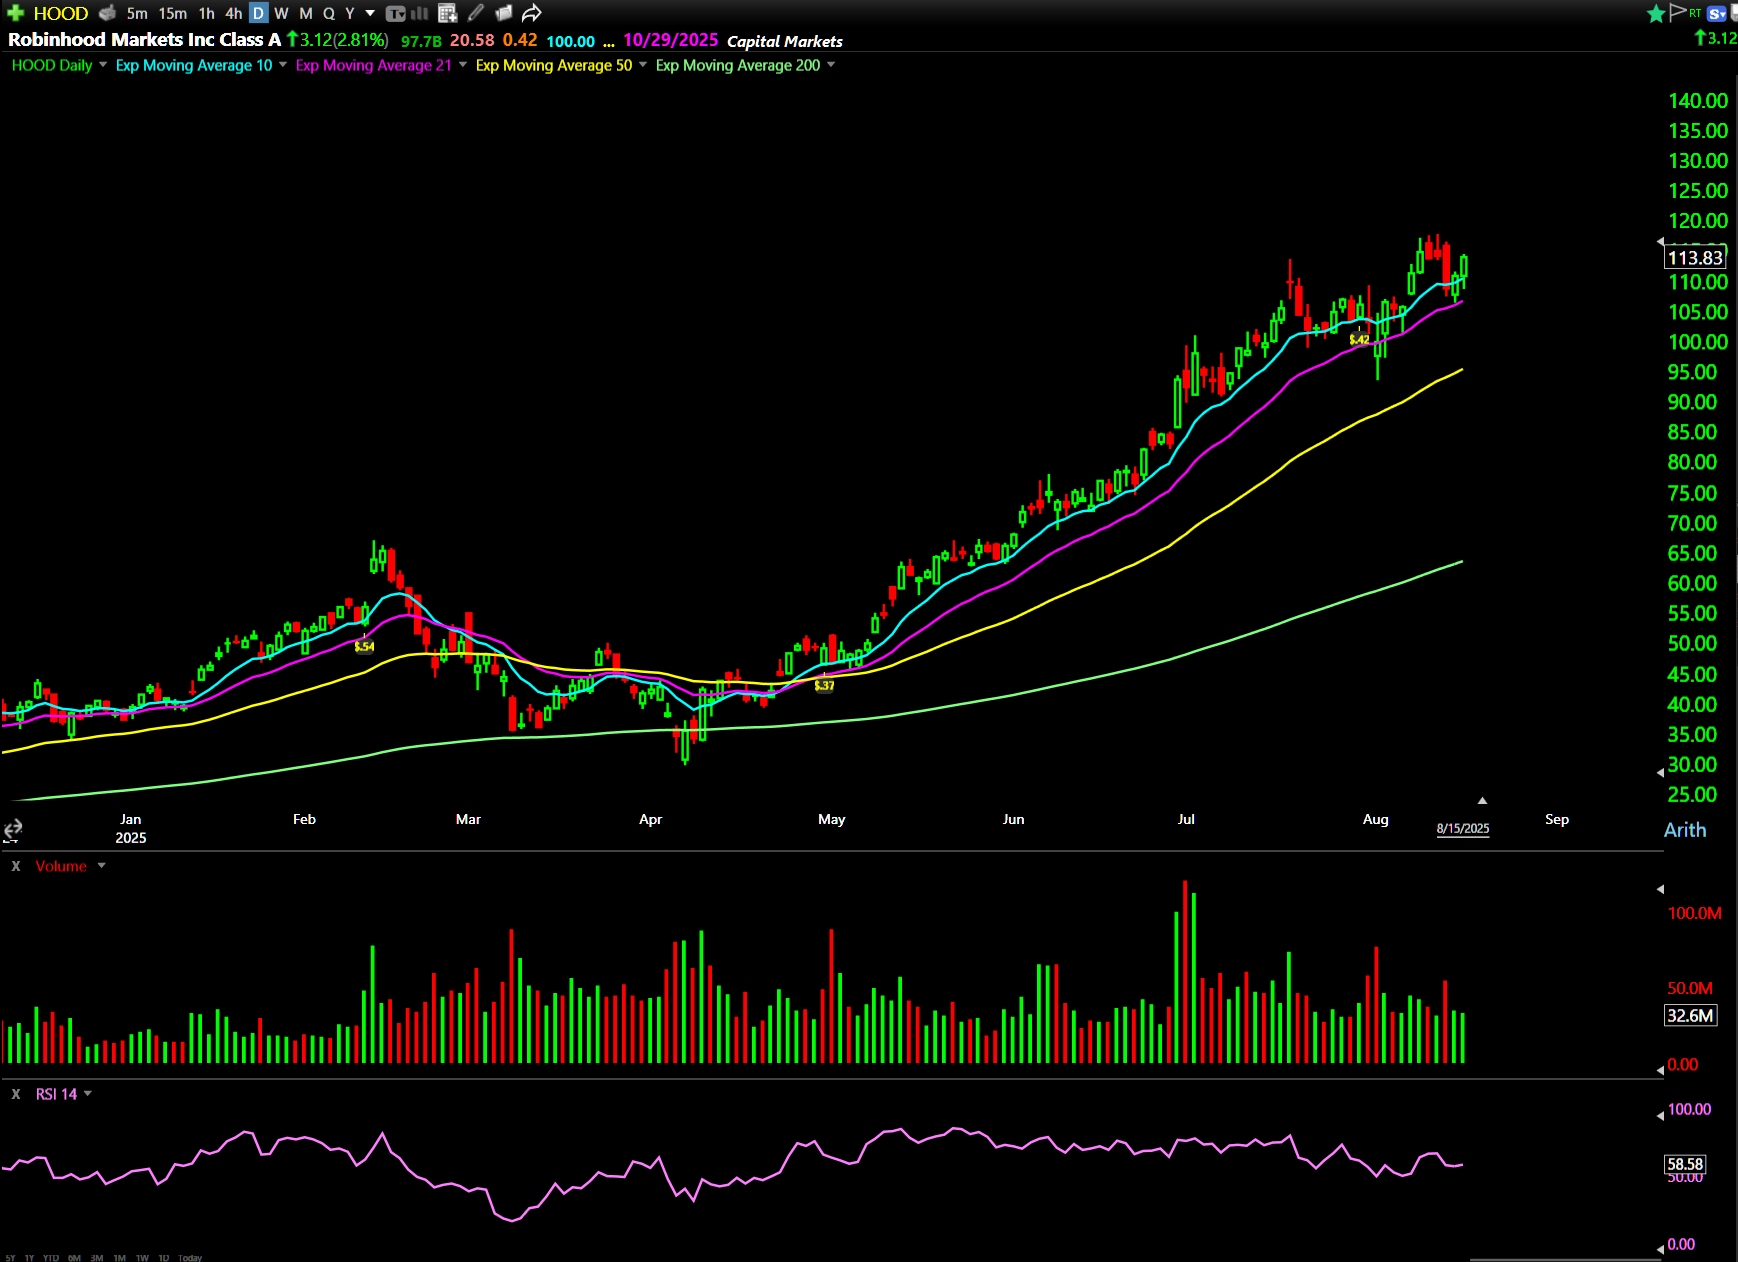
The stock’s up 293% in the four months since then.
The September 19 $100 Calls are up 9550% in the same period.
Had you been thinking about this cycle (and the emotions behind it) at that time, you just might’ve done that.
Try to keep the cycle of fear and greed in mind as you’re trading, and I bet you’ll find some great setups (that greedy traders are missing out on).
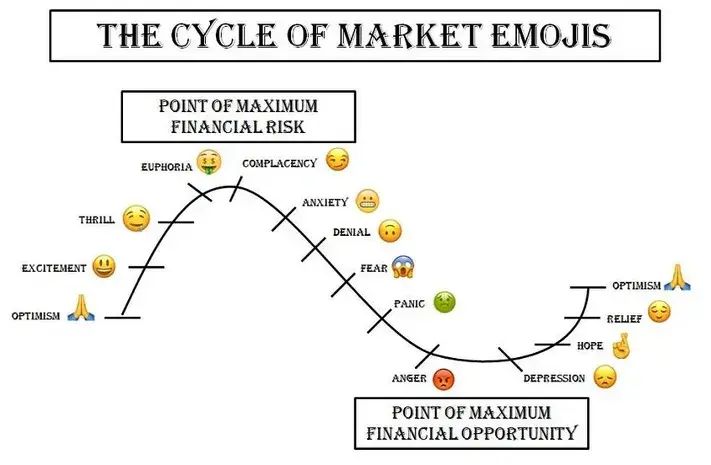
The 11-Step Cycle of Market Emojis illustrates this concept perfectly…
Traders buy and sell stocks based on how they’re feeling.
These dynamics are visible in all risk assets, from options to crypto and even bonds.
If you know what to look for, you can see the cycle of market emotions in both long-term and short-term charts.
By correctly identifying the peaks and valleys of trader emotion — and connecting them to breakouts and pullbacks in individual stock charts — you can gain a massive edge.
Happy trading,
Ben Sturgill
P.S. Want to learn how to execute trades like this?*
The best place to start is in our Smart Money Workshops.
Stop missing the best setups in the options market.
Join us TODAY at 12:00 p.m. EST.
The opportunity is yours. You just have to take it.
*Past performance does not indicate future results