Good morning, traders…
Now is when patience becomes your most valuable asset.
The market has handed us a mixed bag this week. Some names pushed higher, others faded, and most found themselves stuck in the middle.
But think of it this way: choppy markets instill patience.
Range-bound names eventually break out of their ranges. Trending stocks eventually find support and resume their moves. Quality patterns eventually resolve in favor of the patient.
The key is identifying which names are setting up for legitimate moves. Not every pullback deserves your attention. Not every breakout attempt will succeed. Not every range will resolve upward.
However, when you combine technical pattern recognition with Smart Money flow analysis, certain setups rise above the crowd.
These are the names where institutional positioning aligns with reliable chart patterns — the setups that historically produce the highest success rates.
The traders who thrive during uncertain conditions focus on quality over quantity, patience over speed.
Here Are 5 Setups Where Smart Money Flow and Technical Levels Are Telling The Same Story…
Verint Systems Inc. (NASDAQ: VRT)
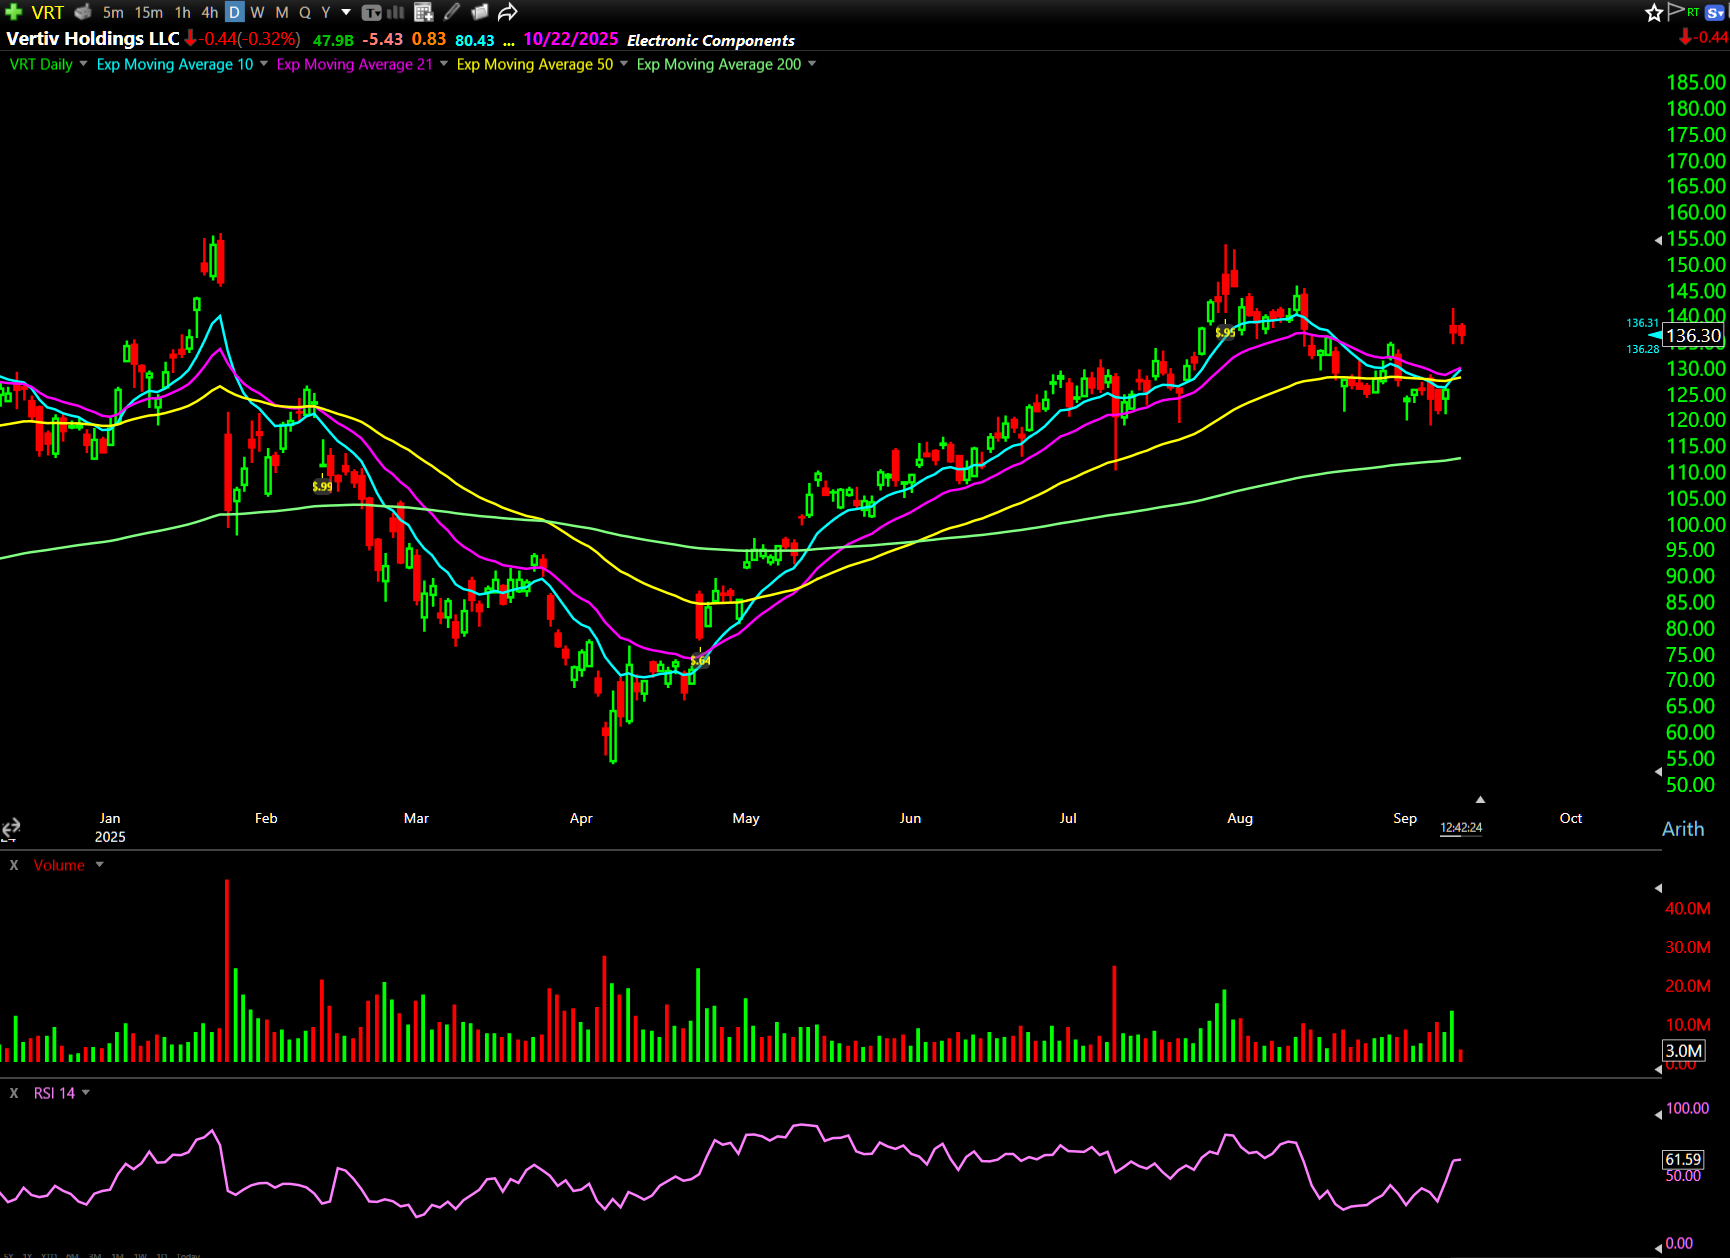
VRT displays the kind of clean uptrend structure that catches Smart Money attention. Higher highs, controlled pullbacks, and now it’s curling after testing the 13-day exponential moving average.
The setup activates if VRT breaks back above $140. I’m watching the October $162.50 Calls for longer-term exposure.
Set your alert around $140. The combination of technical breakout and institutional flow makes this worth monitoring closely.
POET Technologies Inc. (NASDAQ: POET)
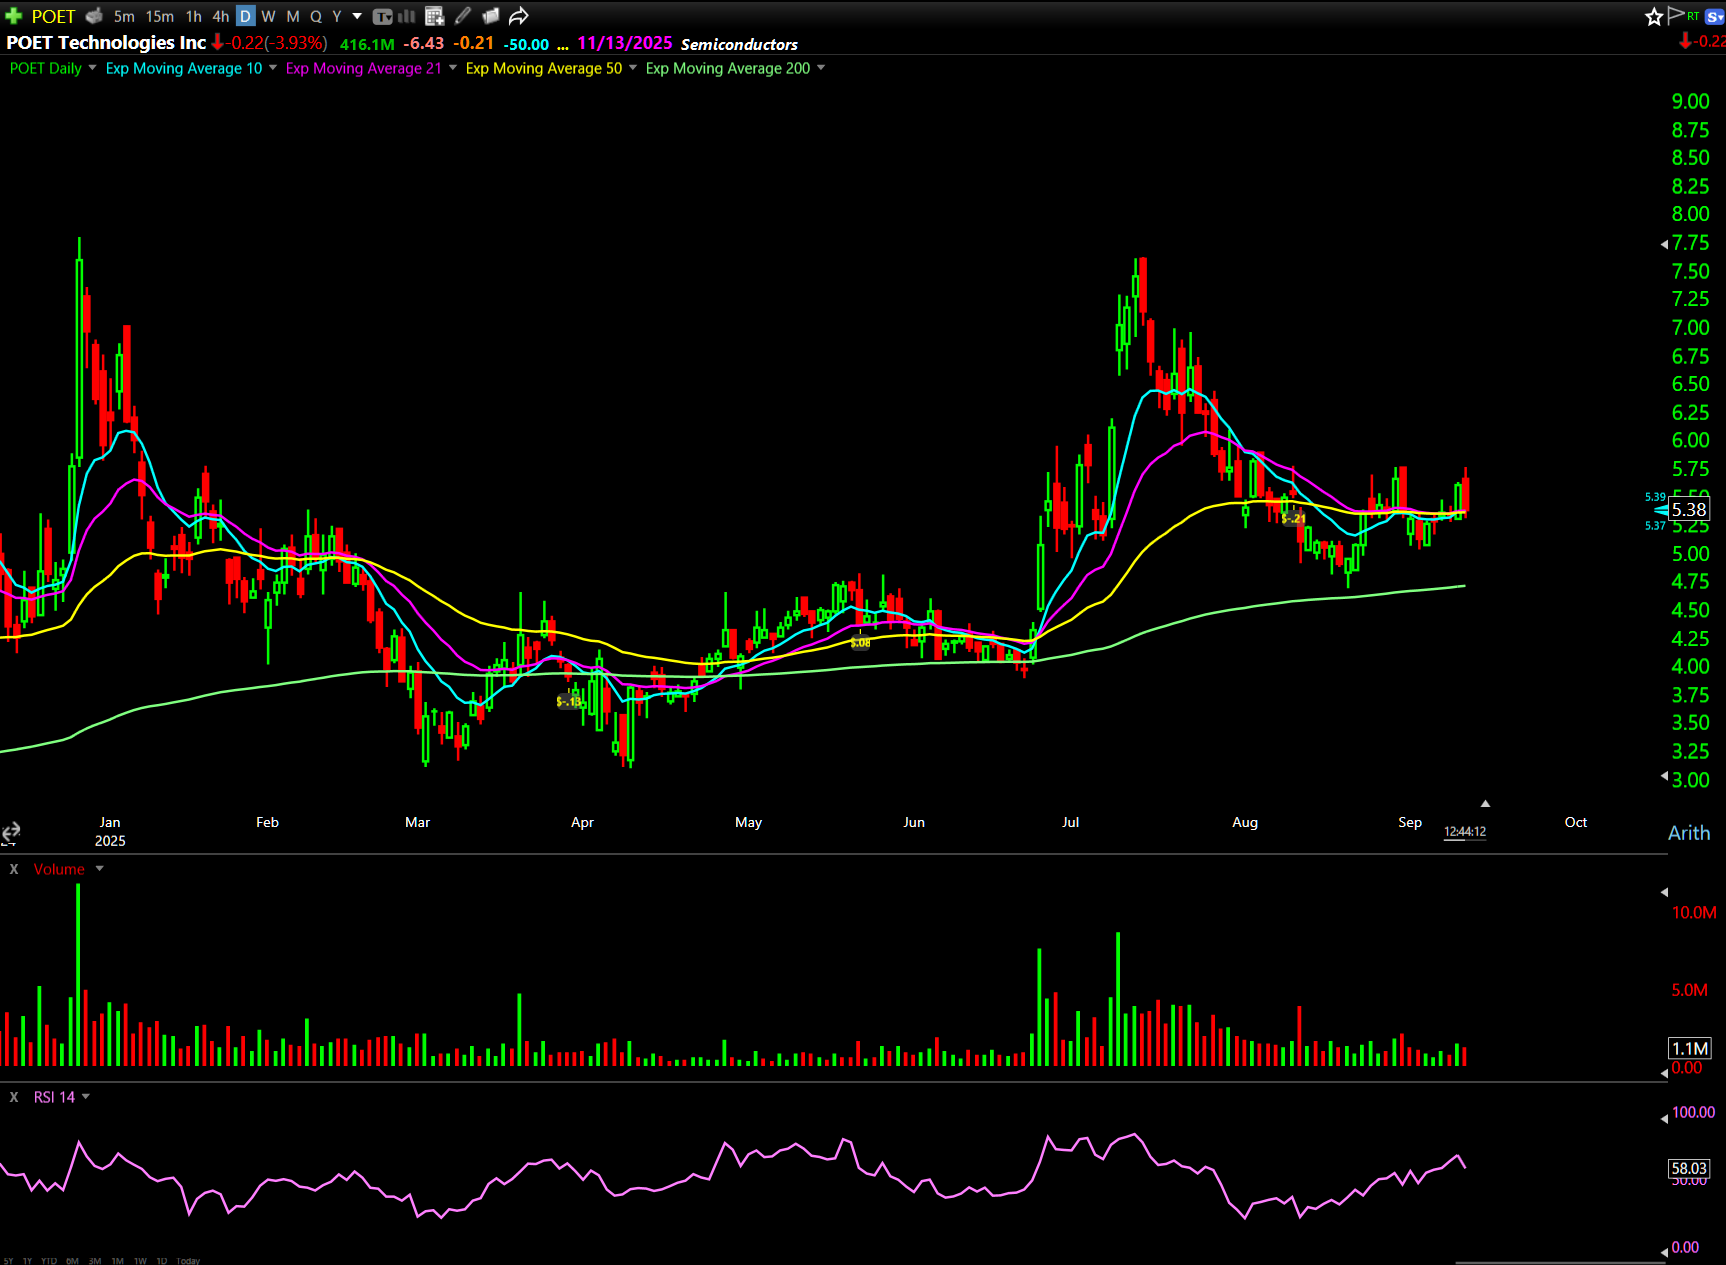
POET is forming a textbook cup-and-handle pattern: pop, drop, base, potential breakout. If the chart clears $5.76, it confirms the pattern and triggers the setup.
Cup-and-handle formations represent some of the most reliable continuation patterns in technical analysis. The extended base allows weak hands to exit while strong hands accumulate, setting up explosive moves when the pattern resolves.
For this setup, I’m considering the April 2026 $7 Calls — way out in time, but that distance provides peace of mind. Time reduces the pressure of perfect timing while allowing the fundamental story to develop.
This approach worked well on a similar biotech setup in July, where patience with longer-dated options produced significant returns even when shorter-term timing wasn’t perfect.
Intel Corporation (NASDAQ: INTC)
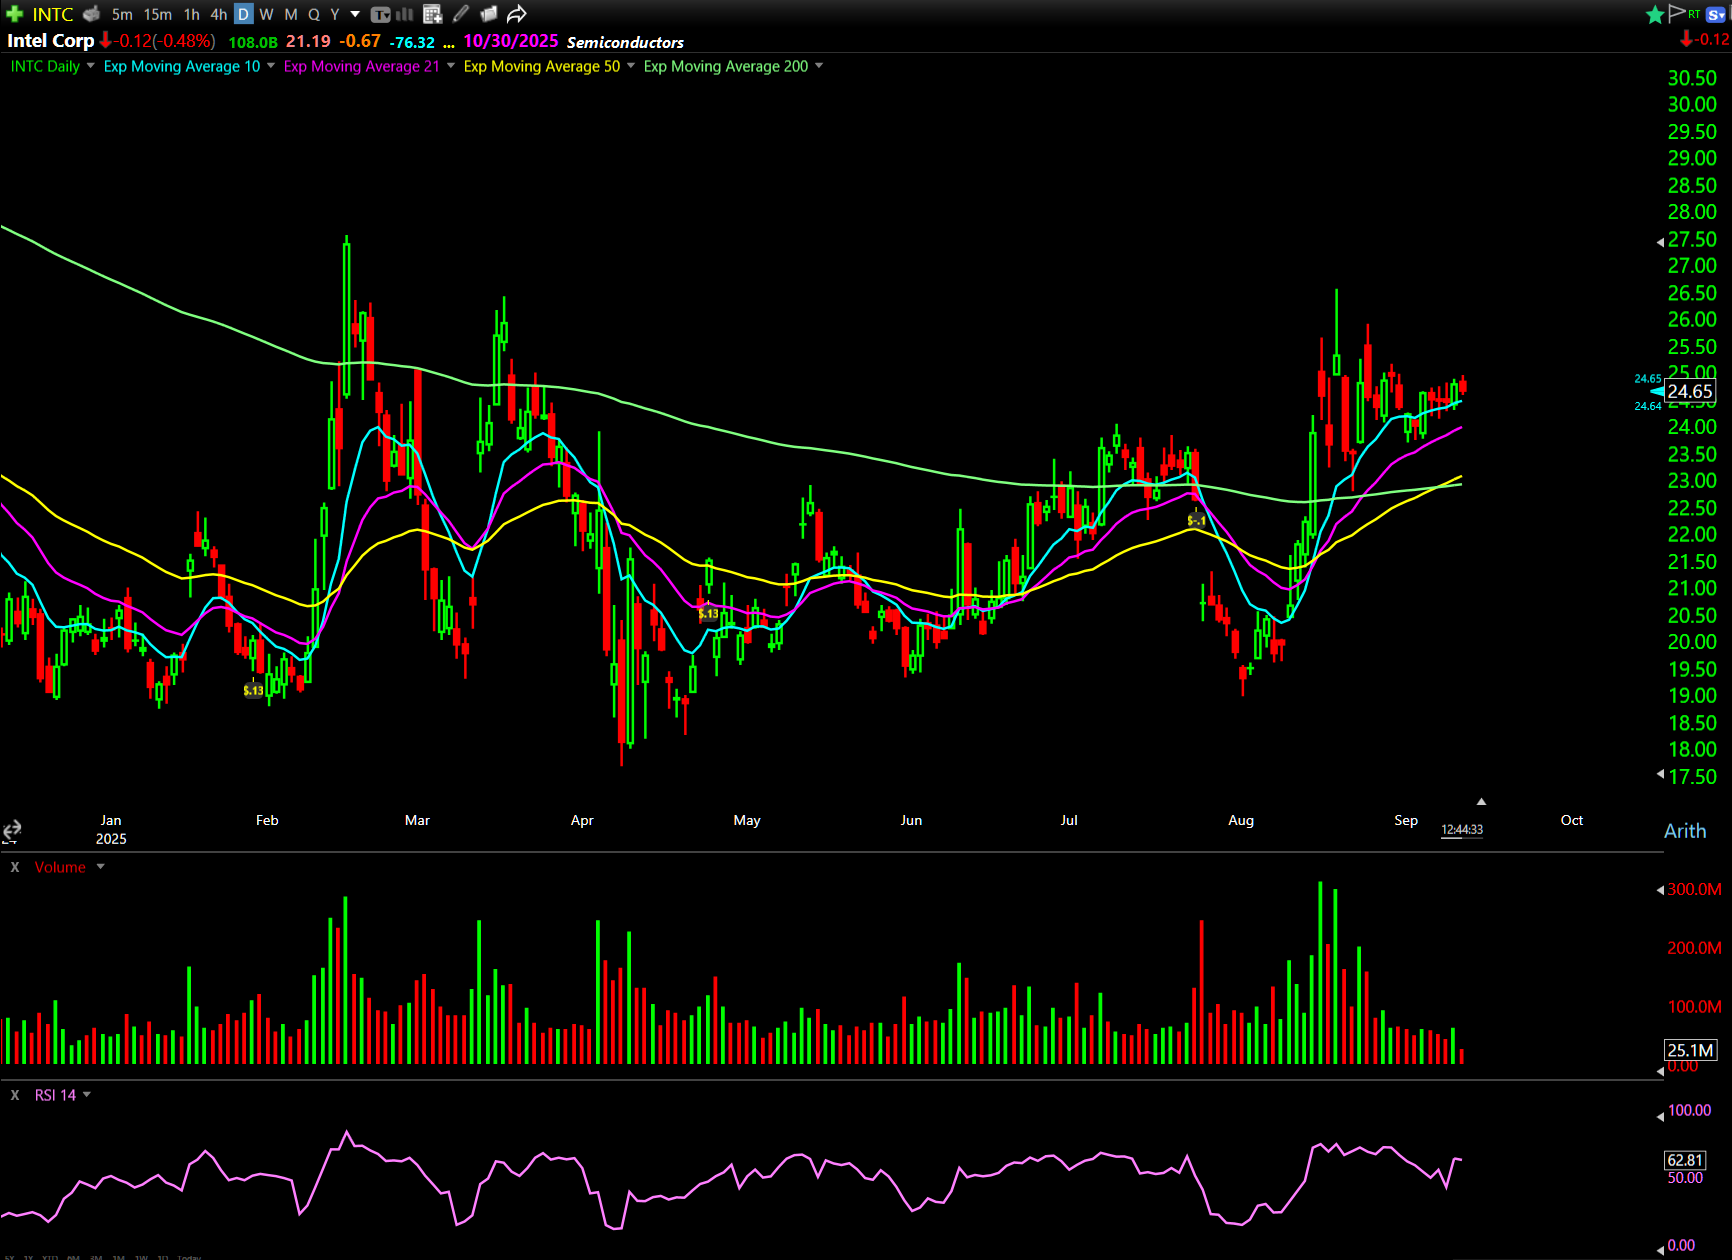
INTC continues to display the run-rest-run pattern we’ve discussed. The chart structure remains constructive, and the October $26.50 Calls still represent valid exposure to this theme.
The fundamental backdrop supports the technical setup. When infrastructure becomes a national priority, companies like Intel often benefit from sustained institutional accumulation.
Look for entries near the 13-day EMA on any weakness, or consider adding on strength if the uptrend resumes. The combination of technical structure and thematic positioning makes this a higher-conviction setup.
Coinbase Global Inc. (NASDAQ: COIN) and Palantir Technologies Inc. (NYSE: PLTR)
Both COIN and PLTR experienced setbacks from previous setups, but the ranges remain intact (and the patterns are resetting).
Coinbase Global Inc. (NASDAQ: COIN) saw significant money flow into the September 19 $340 Calls, but the stock pulled back.
Above $322, the setup reactivates.
Palantir Technologies Inc. (NYSE: PLTR) required a stop-out on the previous setup, but if it reclaims $16.80, the September 12 $16.70 Calls become interesting again.
This illustrates an important principle: when quality setups reset within their ranges, they often deserve a second chance.
NVIDIA Corporation (NASDAQ: NVDA)
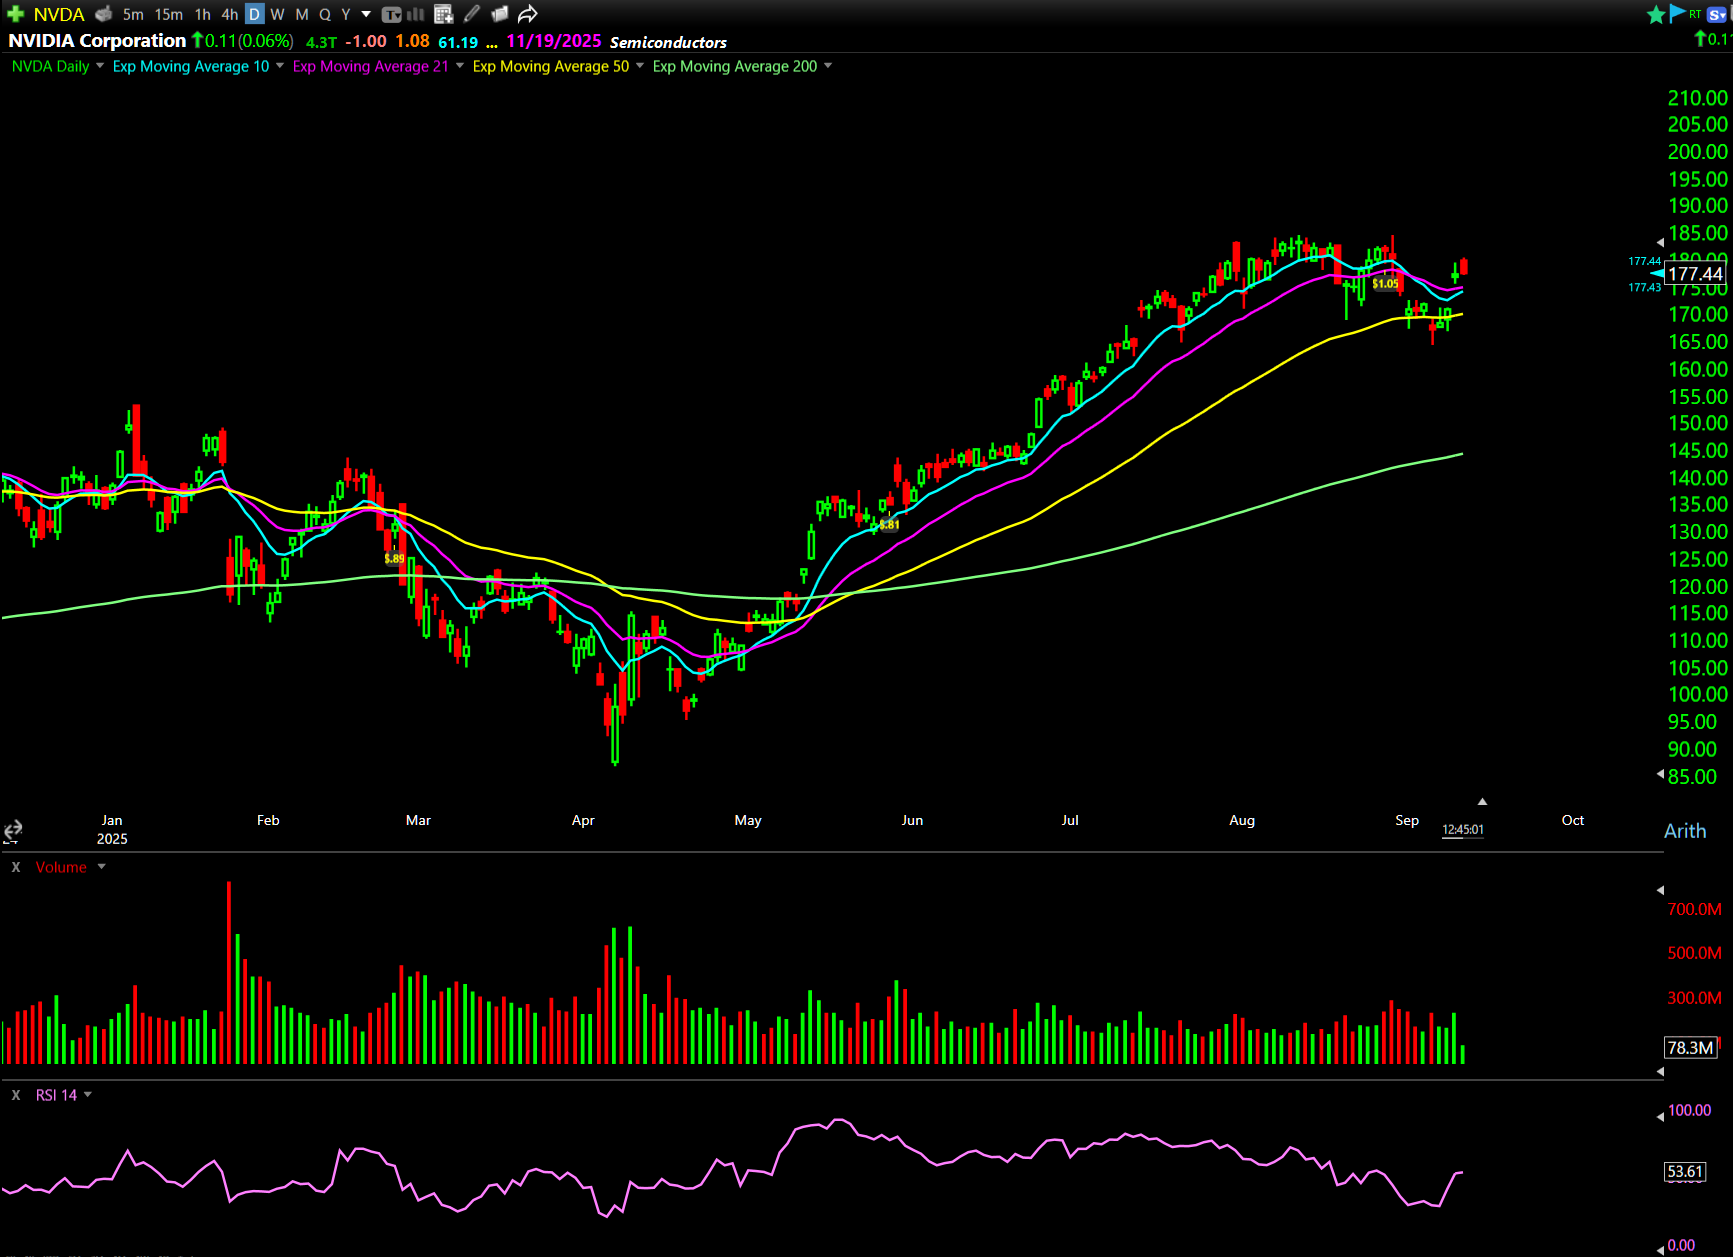
NVDA’s approaching a critical psychological level at $180. Above this price, momentum often accelerates toward $184 or higher levels.
Remember what I’ve said about round numbers…
Round numbers create psychological resistance, but when they break, the moves often extend further than expected. Institutional flows suggest professionals are positioning for this potential breakout.
The September 19 $185 Calls offer exposure to this theme with defined risk and significant upside potential if the level breaks with conviction.
Use This Weekend to Prepare for These Setups
These six setups represent different types of opportunities: range breaks, trend continuations, pattern completions, and psychological breakouts.
Use this weekend to analyze these setups without the pressure of real-time price action.
Pull up each chart and mark the key levels I’ve mentioned. Set your alerts now, before Monday’s opening bell creates urgency and emotional decision-making. Study the patterns so you can recognize similar setups in other names.
This preparation separates successful traders from those who react to opportunities after they’ve already moved.
When Monday arrives and these setups start developing, you’ll be ready to act.
And speaking of being ready to act…
If you want to learn how to execute trades like this…*
The best place to start is in our Smart Money Workshops.
You’re one click away from the best setups in the options market.
Join us this SUNDAY, September 14 at 1:00 p.m. EST.
Happy trading,
Ben Sturgill
*Past performance does not indicate future results